CENSUS OF INDIA 2011 DATA ON DISABILITY
390 likes | 1.03k Vues
CENSUS OF INDIA 2011 DATA ON DISABILITY. Office of the Registrar General & Census Commissioner, India New Delhi, 27-12-2013. Indian Public Sector Employees with Disabilities Social Network http://indianemployeeswelfare.wordpress.com/. Background.

CENSUS OF INDIA 2011 DATA ON DISABILITY
E N D
Presentation Transcript
CENSUS OF INDIA 2011DATA ON DISABILITY Office of the Registrar General & Census Commissioner, India New Delhi, 27-12-2013 Indian Public Sector Employees with Disabilities Social Network http://indianemployeeswelfare.wordpress.com/
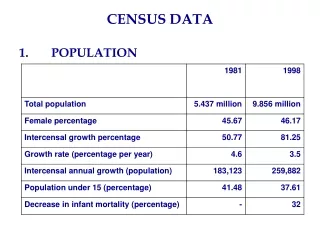
Background • So far the data released from Census 2011 pertained to : • Houselisting and Housing Census • Primary Census Abstract (PCA) covering final results on: • Total population, SC, ST population, Literates, Workers, non-workers and categories of economic activity by sex and residence • PCA on Slums and Houseless Population • PCA for Scheduled Castes and Scheduled Tribes • Age Data in five-years age groups and single-year age returns Indian Public Sector Employees with Disabilities Social Network http://indianemployeeswelfare.wordpress.com/
Present Dataset • The present set of results pertains to data collected in the Census 2011 on disability • Information on disability of individuals was collected during the Population Enumeration phase of Census 2011 through ‘Household Schedule’ . Similar information was collected during 2001 census also. Information for individuals residing in ‘Normal’, ‘Institutional’ and ‘Houseless’ households was collected. • The table C-20- ‘Disabled by age-group and type of disability’ has been generated on the basis of processing 100% Census Schedules. • Note: The figures exclude the population of Mao Maram, Paomata and Purul sub-divisions of Senapati district of Manipur Indian Public Sector Employees with Disabilities Social Network http://indianemployeeswelfare.wordpress.com/
Historical Perspective • The question on disability was canvassed in all the Censuses since 1872 to 1931 • The question on disability was not canvassed in the Censuses from 1941 to 1971 • In Census 1981, information on three types of disability was collected • The question was dropped in Census 1991 • In Census 2001, the question was again included and information on five types of disability was collected • In Census 2011 information on eight types of disability has been collected Indian Public Sector Employees with Disabilities Social Network http://indianemployeeswelfare.wordpress.com/
Questions Canvassed in Census 2011 Codes Indian Public Sector Employees with Disabilities Social Network http://indianemployeeswelfare.wordpress.com/
Features of Disability Question, 2011 • Has a filter question to ascertain disability status • Attempts to collect information on eight types of disabilities as against five in Census 2001. • Designed to cover most of the disabilities listed in the “Persons with Disabilities Act, 1995” and “The National Trust Act, 1999”. • The placement of the question on disability in the Census Schedule was changed. The question was brought forward at Q-9 at Census 2011. This was the question No. 15 at the Census 2001. Indian Public Sector Employees with Disabilities Social Network http://indianemployeeswelfare.wordpress.com/
Special Efforts Made to Improve CoverageTraining • Intensive training at various levels including National Trainers, Master Trainers Facilitators • Training imparted by experts from disability sector using specially developed training modules • Role models from disability groups were invited in training classes to motivate and sensitize Census functionaries • National Centre for Promotion of Employment for Disabled People (NCPEDP) and its alliance partners were associated in developing training modules, imparting training and sensitizing Census functionaries. Indian Public Sector Employees with Disabilities Social Network http://indianemployeeswelfare.wordpress.com/
Special Efforts Made to Improve Coverage (Contd.)Publicity • Wide publicity through electronic and print media undertaken. • Special audio/ video spots prepared in 12 languages for awareness and were telecast on all popular TV and Radio channels across the country • Every video clip had disability component, • Special E-learning module prepared to show as to how to approach and extract information on disability from respondents • Leaflet on disability was prepared and distributed among media persons • Seminars and workshops were held at State level to create awareness • Banners and Posters on disability displayed • Events like Auto Rickshaw rally, car rally, Cycle rally etc. were organized • At Census Directorate level many an innovative modes of publicity were used • Enumerators’ kit included a special flier on disability Indian Public Sector Employees with Disabilities Social Network http://indianemployeeswelfare.wordpress.com/
Special Efforts Made to Improve Coverage (Contd.) Cycle rickshaw rally at New Delhi by the disabled Indian Public Sector Employees with Disabilities Social Network http://indianemployeeswelfare.wordpress.com/
Special Efforts Made to Improve Coverage (Contd.) Posters and Banners Leaflet on disability for Media Kit Indian Public Sector Employees with Disabilities Social Network http://indianemployeeswelfare.wordpress.com/
Definitional Changes 2001-11 Indian Public Sector Employees with Disabilities Social Network http://indianemployeeswelfare.wordpress.com/
Definitional Changes (Contd.) Indian Public Sector Employees with Disabilities Social Network http://indianemployeeswelfare.wordpress.com/
Definitional Changes (Contd.) Indian Public Sector Employees with Disabilities Social Network http://indianemployeeswelfare.wordpress.com/
Data Highlights Indian Public Sector Employees with Disabilities Social Network http://indianemployeeswelfare.wordpress.com/
Disabled Population by Sex and ResidenceIndia : 2001-11 Source: C-Series, Table C-20, Census of India 2001 and 2011 Indian Public Sector Employees with Disabilities Social Network http://indianemployeeswelfare.wordpress.com/
Disabled Population by Sex and ResidenceIndia : 2011 Source: C-Series, Table C-20, Census of India 2001 and 2011 Indian Public Sector Employees with Disabilities Social Network http://indianemployeeswelfare.wordpress.com/
Disabled Population by ResidenceIndia : 2001-2011 • Percentage of disabled persons in India has increased both in rural and urban areas during the last decade. • Proportion of disabled population is higher in rural areas • Decadal increase in proportion is significant in urban areas Indian Public Sector Employees with Disabilities Social Network http://indianemployeeswelfare.wordpress.com/ Source: C-Series, Table C-20, Census of India 2001 and 2011
Disabled Population by Sex India : 2001-2011 Percentage Share of Disabled Population by Sex India, 2011 • Slight increase in disability among both the sexes over the decade • Proportion of disabled population is higher among males • Decadal Increase in proportion is higher among females Source: C-Series, Table C-20, Census of India 2001 and 2011 Indian Public Sector Employees with Disabilities Social Network http://indianemployeeswelfare.wordpress.com/
Proportion of Disabled PopulationIndia and States/UTs : 2011 Indian Public Sector Employees with Disabilities Social Network http://indianemployeeswelfare.wordpress.com/ Source: C-Series, Table C-20, Census of India 2001 and 2011
Disability by Social GroupsIndia : 2011 ( % ) Source: C-Series, Tables C-20, C-20SC and C-20ST, Census of India 2011 Indian Public Sector Employees with Disabilities Social Network http://indianemployeeswelfare.wordpress.com/
Disability by Social GroupsIndia : 2011 Source: C-Series, Tables C-20, C-20SC and C-20ST, Census of India 2011 Indian Public Sector Employees with Disabilities Social Network http://indianemployeeswelfare.wordpress.com/
Disabled Population by Type of DisabilityIndia : 2011 Source: C-Series, Table C-20, Census of India 2011 Indian Public Sector Employees with Disabilities Social Network http://indianemployeeswelfare.wordpress.com/
Disabled Population by Type of Disability (%)India : 2011 ( % ) Proportion of Disabled Population by Type of Disability India : 2011 (Persons) Indian Public Sector Employees with Disabilities Social Network http://indianemployeeswelfare.wordpress.com/ Source: C-Series, Table C-20, Census of India 2011
Disability by Type and SexIndia : 2011 ( % ) • Disability in seeing and hearing is more among females • Disability in movement is more among males Source: C-Series, Table C-20, Census of India 2011 Indian Public Sector Employees with Disabilities Social Network http://indianemployeeswelfare.wordpress.com/
Disabled Population by Type and Residence(%)India : 2011 ( % ) • Disability in hearing and speech is more in urban areas • Disability in movement and multiple disability is more in rural areas. Source: C-Series, Table C-20, Census of India 2011 Indian Public Sector Employees with Disabilities Social Network http://indianemployeeswelfare.wordpress.com/
Disabled Population by Type and Social Group (%)India : 2011 ( % ) • Disability in seeing, hearing and movement and multiple disability is more among STs than that of SCs and Others • Disability in speech and mental retardation is more among others than that of SCs and STs Source: C-Series, Tables C-20, C-20SC and C-20ST, Census of India 2011 Indian Public Sector Employees with Disabilities Social Network http://indianemployeeswelfare.wordpress.com/
Percentage Share of Disabled Population by Type and Social GroupIndia : 2011 • Disability in seeing, movement and multiple disability is more among STs than that of SCs and Others • Disability in speech and mental retardation is more among others than that of SCs and STs Source: C-Series, Tables C-20, C-20SC and C-20ST, Census of India 2011
Disabled Population by Age and SexIndia : 2011 ( % ) Source: C-Series, Table C-20, Census of India 2011
Proportion of Disabled Population in the respective age groups India : 2001-11 Source: C-Series, Table C-20, Census of India 2001, 2011 Indian Public Sector Employees with Disabilities Social Network http://indianemployeeswelfare.wordpress.com/
Proportion of Disabled Population in the respective age groups by sexIndia : 2011 ( % ) • Disability among males is higher upto the age group 70-79 • Disability among females is higher thereafter Indian Public Sector Employees with Disabilities Social Network http://indianemployeeswelfare.wordpress.com/ Source: C-Series, Table C-20, Census of India 2011
Percentage of disabled population to total population of the age groupIndia : 2011 Note: In compliance to the concept adopted in Census, Population aged 0 to 3 years are excluded while calculating the percentage for “Speech” disability Indian Public Sector Employees with Disabilities Social Network http://indianemployeeswelfare.wordpress.com/ Source: C-Series, Tables C-20, Census of India 2011
Percentage of disabled population to total population of the age group (Contd.)India : 2011 Indian Public Sector Employees with Disabilities Social Network http://indianemployeeswelfare.wordpress.com/ Source: C-Series, Tables C-20, Census of India 2011
Disabled Population by Age and Social GroupsIndia : 2011 ( % ) • Disability among STs in lower age-groups upto 40-49 is significantly lower than the other social groups • In the higher age group i.e. 60 onwards, it is high among STs • Disability among SCs is invariably higher than Others in all age-groups Source: C-Series, Tables C-20, C-20SC and C-20ST, Census of India 2011
Disabled Population by Age and Social Groups (Contd.)India : 2011 Proportion of Disabled Population by Age SCs, STs and Others India, 2011 • Disability among STs in lower age-groups upto 40-49 is significantly lower than the other social groups • In the higher age group i.e. 60 onwards, it is high among STs • Disability among SCs is invariably higher than Others in all age-groups Source: C-Series, Tables C-20, C-20SC and C-20ST, Census of India 2011 Indian Public Sector Employees with Disabilities Social Network http://indianemployeeswelfare.wordpress.com/
Thank YouWebsite: http://www.censusindia.gov.inE-mail: rgi.rgi@censusindia.gov.in Indian Public Sector Employees with Disabilities Social Network http://indianemployeeswelfare.wordpress.com/