Download
1 / 61
610 likes | 762 Vues
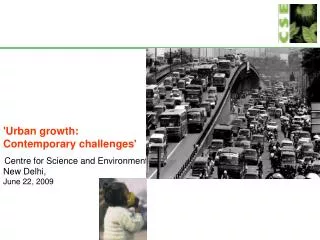
'Urban growth: Contemporary challenges' Centre for Science and Environment New Delhi, June 22, 2009. Urban roots. Cities emerged along the riverine trade routes – linked to indigenous economy. Patna: A thriving trading city during 17 th and 18 th century.

E N D
'Urban growth: Contemporary challenges' Centre for Science and Environment New Delhi, June 22, 2009
Urban roots Cities emerged along the riverine trade routes – linked to indigenous economy Patna: A thriving trading city during 17th and 18th century
Traditional cities decayed as colonial port cities grew in prominence Chennai Kolkata Beginning of public transport and also motorisation
We built walkable cities Kolkata
Unprecedented urban growth 1950-2006: The urban population of the world has increased from 739 million to 3.2 billion. By 2025 around 65 per cent of the world’s population is projected to live in cities. By 2010 more than 75 per cent of the world’s urban population will live in poorer countries (State of the World 2007). More than 40 per cent of the world children are estimated to be living in polluted cities of developing world (WHO). A billion more will be added over the next three decades in Asia – almost adding a whole new India. More than half of them will be living in cities What about India?
Urban growth: A mixed trend Exponential annual growth in urban population during 1940s, 50s and 70s … Agrarian crisis pushed people out of villages. They came to cities in search of livelihood ….. 80s and 90s: Urban growth rate drops – from 3.8% in the 70s to 2.7% in 90s. Share of urban population increased slowly from 17.3%in 1951 to 27.78% in 2001. The share of migrants in the total incremental urban population dropped from 21.7% in 80s to 21.0% in the 90s. This co-relates well with drop in the rate of urbanisation during the nineties. Urban population is projected to grow in the coming decade. The total urban population is already as big as 287.56 million which is almost equal to the total population of the United States.
Problem of skewed growth Top heavy growth: The million plus cities (Class I) are growing faster than the smaller cities – growth is not evenly distributed. Bulk of industrial and manufacturing concentrate around a few large cities….. Asymmetrical growth: Total towns increased from 1827 in 1901 to 4368 in 2001. Million plus cities increased from 24 in 1901 to 393 in 2001. Share of urban population in these cities increased from 26% in 1901 to 69% in 2001. The remaining 30% distributed in the remaining 3979 towns and cities. Stagnation at the bottom: The transformation of rural settlement as urban centres is not so pronounced. Lower rung towns largely stagnating. Some have grown due to infrastructure investments and rural to urban migration. Shadow growth: Top rung cities that have grown due to in-migration and aerial expansion show strong trend towards suburbanisation.
Inequity, social and environmental imbalances in cities Big cities have not been able to absorb labor and investments within the formal sector of economy leading to problem of slums and informal economy. 21% of urban population live in slums. Nearly 40-50 per cent of people live in slums of Mumbai. About 25.7% of the urban population live below the poverty line. While in class I cities 12 per cent of the households are below poverty line, in medium towns it is 23% -- even higher than rural areas. Urban planning has tried density control through physical planning but failed to check in-migration or address the issue of basic services. Social and environmental impacts of these trends are severe as there is also high level of inequity in the provision of basic services in cities. Poor are pushed to periphery.
The challenge of urban governance • Gregarious use of energy, resource metabolism of cities and their enormous wastes challenge urban governance. • This demands very strong regulatory capacity to address these problems and to improve liveability of cities. • Change planning mindset. Urban planning and design should aim for public health, low carbon and energy footprint, and urban community wellbeing. • Implement integrated policies to minimise resource use, and waste generation and improve liveability of cities. • Improve urban municipal governance
How are we going to manage this growth? The issue is not about growth but about distribution, equity and urban governance Air pollution and mobility crisis: Cities are being built for a small group of car owners, disregarding the mobility needs of the majority of urban population. Pollution and congestion costs high. Solid waste and hazardous waste: 120,000 tonnes of garbage everyday in Indian cities. But very limited disposal, re-use and recycling capacities. Waste to energy remains a non-starter. Colonisation of land for waste disposal is leading to conflicts. Water and waste water: Per capita water supply ranges from 9 lpcd to 584 lpcd across urban India. Only 72 cities have partial sewerage facilities and 17 have some primary treatment facilities and ….. Energy impacts: Cities are products of abundant cheap energy. Wide gap in demand and supply, wastage. One third of India living in cities consumes 87% of nation’s electricity. Remains energy inefficient. Both direct use of energy like fuels for vehicles, electricity, heating, cooling, etc and also embodied energy of building materials, and consumer items etc. are high and wasteful. Land constraints: Urban sprawl build more inefficiencies
Maximum city `Vision Mumbai’ (Mackinsy Plan)… Build another Shanghai… it hits out at poor… reduce slums… build free ways and expressways….What about equity? 49% of population are in slums……..
Urban sprawl – glitzy towns in dark shadows….. Privatised new towns……Town of affluent but infrastructure of poor-- 70% of water needs from ground water; Groundwater table falling at a rate of 1 to 1.2 meters annually; dropped by 16 meters in last 20 years-- Only 40% of the DLF area connected by sewer line-- Only 70-75% of solid waste transported; No landfill site-- Poor public transport connectivity -- Due to acute power shortage heavy dependence on generator-sets-- Violation of development rules related to open spaces and community services
If cities grow big its scale and density also make waste treatment, recycling facilities, and public transport more efficient. …..But efficiency gains can be limited in Indian cities due to poor urban governance…..
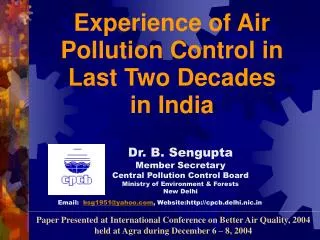
Positioning the debate • Air pollution, public health, energy and vehicles…..
Exploding the myth of safe air Public health policy still ignores the link between air pollution and health Particulates and other air toxins like benzene can be lethal even in small doses WHO mandates no safe level WHO recommends not only eliminating extreme cases of high pollution but decreasing average exposure levels among all. How far tiny particles penetrate your lungs Ultrafine particles 0.65 microns Magnified 200,000 times
Daily dose of poison and combat priority Fine particulate matter (PM10 and PM2.5): Trigger lung cancer, respiratory and heart problems. Very high levels in cities. Oxides of nitrogen: Forms smog and ozone. Triggers respiratory and heart problems. A growing national problem Carbon monoxide: Reduces oxygen carrying capacity of blood. Impairs hearth and nervous system. High levels but on the mend. Sulphur dioxide: Very low levels. But contribute to deadly sulphate particles. Toxic. Benzene: Carcinogenic: Triggers blood cancer Polycyclic aromatic hydrocarbons: Cause cancer. Dangerous even at trace levels. Tiny killers – particulates – most dangerous in Indian cities • More challenges….. • Newer technology solutions have further splintered the particles into an invisible size that defies measurement. • Caught in trade offs. Technologies needed to control particulate emissions have increased other harmful and health damaging pollutants like NOx and its attendant problem of ozone.
India: Proliferating hotspots Half of the cities are critically polluted due to high PM10, even NO2 is rising in many of them – a twin trouble Source: Estimated based on CPCB data, comparison with residential area standard
City based clean air action plan takes root… • Opportunity for integrated action….. • Nearly 56 cities have city action plans. The process has accelerated in 8 cities. • City based plan identifies the combination of local, state, and central actions and emission controls strategies for pollution control. • The city based action must be strengthened further to define target reduction, and related control measures, with schedule for implementation and compliance • Build strong interface between national air quality planning process and city based action • Delhi is an important example……
Deadly particles: After a short respite the curve turns upward Source: CPCB
NOx levels: rising steadily NAAQS (R) 60 microgram per cubicmetre Source: CPCB
Deadly particles The PM10 trend in key cities Evidence of action in big cities. Falling PM10 levels. But still unacceptable levels. There is still a long way to go Source: Estimated based on CPCB data, comparison with residential area standard
The new threat NO2 trend in key cities NOx levels are rising in many cities. Kolkata is among the NOx hotspots Source: Estimated based on CPCB data, comparison with residential area standard
(1) The great guzzle….. • The great guzzler: Transport sector uses up nearly 40 per cent of total consumption of oil and oil products • Explosive vehicle numbers: Four wheelers increased five fold in two decades. Consumption of fuels by vehicles in 2035 could be six times that of the 2005 level. This increase to be driven by light-duty vehicles, at an annual average growth of 10 per cent by 2030. • LCVs will burn up nearly the same amounts of total energy consumed by the entire transport sector today. Heavy-duty vehicles will still splurge the most. Can we afford this when nearly 85 per cent of our crude oil needs will be imported at exorbitant rates by 2030? (WEO 2007)Shift of freight from railways to trucks: Share of railways down to 26%. Transport energy demand in India would grow even faster if all highways planned are constructed. (WEO 2006) • Pressure of high commuting demand: By 2030-31 on an average Indians will travel thrice as many kilometers as they traveled during 2000-01.
2) Great guzzle… • Strong consumer interest in fuel efficiency: Urban Indians increasingly spending more on conveyance. Monthly expenditure data from the CSO shows that between 1993-94 and 2004-05, the share of expenses on transport has gone up -- from 11.3% to 17.1% and that on food has declined. • CO2 mitigation a challenge in the transport sector: IEA’s WEO 2006 estimates transport’s share to CO2 emissions from oil is around 35% in India. • Higher fuel prices hurts. It hurts more if vehicles are fuel inefficient. • Rolling stock of inefficient vehicles will continuously lock up huge amount of energy • Sheer numbers of cars will undercut the fuel savings possible from public transport.
Are we losing it? Small and medium cars will remain dominant. But…… Shift towards heavier and powerful cars expected at a faster rate. This will negate efficiency gains..
The subtle link…. • Local pollution can enhance the warming effects…. • HC + NOx lead to regional ozone but also to background hemispheric ozone • CO becomes CO2 but consumes OH radicals along the way increasing CH4 • Diesel PM increases PM10 & PM2.5 & ultrafine PM but also black carbon • Now the emerging science says that warming gases can enhance local public health impacts as well…e.g., each increase of 1 degree Celsius caused by carbon dioxide, can enhance PM and ozone build up. The resulting air pollution can lead thousands of additional deaths and many more cases of respiratory illness and asthma etc. (Mark Jacobson 2008)
Fight for efficiency….. • Pressure building up for fuel economy standards. Industry resistant • Auto fuel policy asked for mandatory voluntary declaration of fuel economy levels of car models This has not been enforced. • Integrated Energy Policy 2006……. • The Integrated Energy Policy 2006 proposes improvement in vehicle fuel economy by 50 per cent by 2030. Oil requirement can go down by nearly 86 million tonnes by 2031-32.This means a saving of US$ 36 billion at the rate of nearly US$ 57 per barrel of crude oil • This amounts to 65 per cent of total current consumption and in terms of carbon dioxide • emissions reduction it is equal to removing 7 million of today’s four wheeled vehicles.
Challenge of air quality governance • A spate of laws in India.. • December 1984: Bhopal Gas Disaster • India learns the pain of industrial growth. • 1986: The Environment Protection Act is passed. • Environmental Impact Assessment mandated. • Environmental audits introduced. • But by the mid-1990s things were out of hand. Pollution in cities, ….toxic contamination growing.
Air quality planning: Challenge of governance • The paradox: Trend toward strong environmental laws. • But governments do not act. • Role of civil society and Judiciary becomes important • Public interest litigation (PIL) provides opportunity to the civil society to drive policies • Judiciary intervenes as the executive fails.
Fractured governance Total air quality management approach missing Multiple agencies contribute either directly or indirectly to the norm setting process related to emissions and fuel quality for vehicles, transportation measures and setting of overall policies for ambient air quality. The Planning Commissions in one of its reporthas stated that the SPCBs have been reduced to “only Industrial Pollution Control Boards”. Implementation of the regulations related to the vehicular pollution, for instance, does not fall within the jurisdiction of the CPCB and SPCBs. Role of civil society and Judiciary becomes important. Public interest litigation (PIL) provides opportunity to the civil society to drive policies Judiciary intervenes as the executive fails.
Clean air targets still elusive • India has adopted national ambient air quality standards • Time bound air quality targets are not set to meet standards • No punitive action on state governments for not meeting theambient air quality norms. • Abatement plans are not designed to meet local air quality demands • Weak air quality surveillance impedes informed decision making Ensure enforcement of air quality standards, accountability and compliance.
Toxic diesel….. Diesel cars more fuel efficient. But carbon content of diesel higher. So CO2 emissions increase if more fuel is burnt. PM and NOx emissions are several times higher. Diesel soot is also a warming agent. 1998: Diesel cars only 2% of the new car sales in Delhi. 2007: Diesel cars nearly 30% of new car sales 2010: Projected to be 50% of the sales
Technology lag….. • Between 1996 and 2005 the amount of fuel used for each 100 km driven by new cars in the UK decreased by 6% as a result of improvements in efficiency. • Emissions of CO2 from private cars rose by 4% in the same period, mainly because of increasing distances travelled by car, which rose by 10%. • PM10 emissions declined by 29% between 1996 and 2000 but subsequently decreased by only a further 3% … the improvements offset by an increase in the use of, and emissions from, diesel cars.
“New diesel cars in India are clean” - A Myth? Post 2005 diesel car model: High levels of PM, NOx and air toxics; Overwhelms the CO2 advantage: A crippling trade-off NOx PM Total air toxics CO2
Solution exist to make diesel vehicles clean. But we do not have policies to enable them…. Source: ICCT
Explosive numbers: A special challenge Vehicle registration in India: India’s urban population has grown 4.6 times, vehicle numbers have increased 158 times It took 30 years to reach the first million mark for personal vehicles in 1971. Another 20 years to add two more million Then in 10 years (1981-91) increased by 14 million Another 10 years (1991-2001) – jumped by 28 million This decade just in four years (2001 to 2004) we have added 16 million Source: Computed on the basis of MOSRTH motor vehicle registration data
Where is the space for more cars? Between 1996 and 2006 total road length in Delhi has increased by about 20 per cent. But cars increased by 132 per centDelhi has 21 per cent of its area under roads; only quarter of its population own cars; cars and two-wheelers together drive less than 20 per cent of its people -- and yet roads are choked
Peak volume traffic has increased phenomenally Nearly 123 per cent growth on many roads (in PCU/hour) Source: Based on City Development Plan of Delhi, 2006, Eco Smart
Cars encourage urban sprawl The “Gurgaon” cataclysm Development and density controls also encourage move towards suburbs; e.g. Satellite towns around Delhi, Mumbai suburbs etc. Uncontrolled suburbanisation: Gurgaon, 32 kilometer from Delhi: 1961: 37868 population. 2001: 1.66 million. Car dependent city -- unfettered growth despite severe water constraints. 70% of water demand met from ground water. Alarming drop in ground water level. No land for solid waste disposal. Satellite townshipshave created 3.42 million daily trips -- of these 37 per cent of the trips are made from Delhi to NCR, 42 per cent from NCR to Delhi and the rest of the trips occur in NCR but outside Delhi – add to pollution and congestion.
Result congestion…. Peak hour traffic speed plummets…It can be as low as 10 hours per hour in Delhi, or 7 km per hour in Kolkata… Congestion costs can be as high as Rs 3000 to 4000 crore per year. ASSOCHAM study: the commuting population could be losing Rs 420 million human hours in congestion. Each day 2.5 hours are lost in commuting to destinations.
Strike at the very root…. • Restrain personal vehicle usage. • Build public transport • International Energy Agency estimates 100 per cent difference in oil use in a future scenario dominated by high quality bus system as opposed to that dominated by personal vehicles in Delhi • ADB study projects that in Bangalore an increase in public transport share from 62 per cent to 80 per cent can save 21 per cent of fuel consumption.