Download
1 / 86
930 likes | 1.78k Vues
Experience of Air Pollution Control in Last Two Decades in India. Dr. B. Sengupta Member Secretary Central Pollution Control Board Ministry of Environment & Forests New Delhi. Email: bsg1951@yahoo.com , Website:http://cpcb.delhi.nic.in.

E N D
Experience of Air Pollution Control in Last Two Decades in India Dr. B. Sengupta Member Secretary Central Pollution Control Board Ministry of Environment & Forests New Delhi Email: bsg1951@yahoo.com, Website:http://cpcb.delhi.nic.in Paper Presented at International Conference on Better Air Quality, 2004 held at Agra during December 6 – 8, 2004
Important ActDEALING WITH AIR POLLUTION CONTROL IN INDIA • Air (Prevention and Control of Pollution) Act , 1981 • Environmental Protection Act, 1986 • Factory Act (Occupational Health) 1987
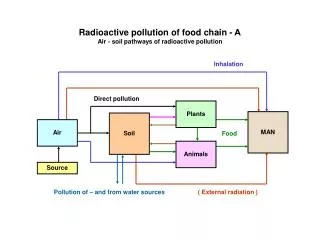
Major Air Pollution Issues in India • 1. Major Cities (53 non-attainment areas mainly due to vehicular pollution) • 2. 24 – Critically polluted area (Industrial Air Pollution) • 3. Indoor Air Pollution (Rural Area) and Air Pollution in work zone area
Reasons for High Air Pollution in India • Quality of fuel (coal, diesel, petrol, fuel oil) • Toxic and hazardous air pollutants emission from chemical industries, (pesticides, dye and dye intermediate, pharmaceutical etc) specially located in industrial estates (Gujarat, Maharashtra, A.P. and Tamil Nadu) • Use of high ash coal for power generation • Siting of small industries specially industrial estates • No pollution preventive step taken (early stage of industrialization) Conti…..
Reasons for High Air Pollution in India Predominance of 2-stroke in use vehicles Uncontrolled growth of vehicle population and poor i/m system for in use vehicle Inadequate pollution prevention and control system in small/ medium scale industry (s.M.S) (brick kiln, foundry, stone crusher etc.) Poor compliance of standard in s.M.S. Large number of polluting genset operating in commercial area
Particulate Matter Emission Load From Major Air Polluting Industries Share of Suspended Particulate Matter Load (tonnes/day) by Different Categories of Industries (With Control Device), Total Load = 5365 tonnes/day
Sulphur Dioxide Emission Load from Major Air Polluting Industries Share of Sulphur Dioxide Load (tonnes/day) by Different Categories of Industries (Total Load = 3715 tonnes/day)
List of Critically Polluted Areas (Identified During Eighties) Contd…
List of Critically Polluted Areas (Identified During Eighties) Contd…
List of Critically Polluted Areas (Identified During Eighties)
Air Polluting Industries for which Emission Standard Developed and Enforced by SPCB Contd..
Air Polluting Industries for which Emission Standard Developed and Enforced by SPCB
Inventory of Vehicular Emissions
Percentage Share of Different Category of Vehicles in Nine Metro Cities in India
Ventilation Co-efficientin Nine Metro Cities in India (2001)
Epidemiological Studies Initiated by CPCB in India • Epidemiological Study to find the Effect of Air Pollutants especially Respirable Suspended Particulate Matter (RSPM) and other carcinogens on Human Health in Delhi – CNCI, Kolkata • Study on Ambient Air Quality, Respiratory Symptoms and Lung Function of Children in Delhi – CNCI, Kolkata • Effects of Environmental Pollution on the Status of Human Health of Delhi Residents – AIIMS, New Delhi • Human Risk Assessment Studies in Asbestos Industries in India- ITRC, Lucknow • The Environmental benefits Mapping and Analysis Program for International Applications (BenMAP – International) Training and Demonstration in India - USEPA
Lung Function Impairment in Residents of Delhi (Non-smokers) Pattern of impairment
National Ambient Air Quality Standards (Naaqs) (1982, 1994) Time Weighted Average Concentration in Ambient Air Method of Measurement Industrial Area Residential, Rural and other Areas Sensitive Area Pollutant Sulphur Dioxide (SO2) Annual Average* 80 µg/m3 60 µg/m3 15 µg/m3 1. Improved West and Gaeke Method 2. Ultraviolet Fluorescence 24 Hours Average** 120 µg/m3 80 µg/m3 30 µg/m3 Oxides of Nitrogen as NO2 Annual Average* 80 µg/m3 60 µg/m3 15 µg/m3 1. Jacob & Hochheiser modified (NaOH-NaAsO2) Method 2. Gas Phase Chemiluminiscence 24 Hours Average** 120 µg/m3 80 µg/m3 30 µg/m3 Suspended Particulate Matter (SPM) Annual Average* 360 µg/m3 140 µg/m3 70 µg/m3 High Volume Sampling (Average flow rate not less than 1.1m3/minute) 24 Hours Average** 500 µg/m3 200 µg/m3 100 µg/m3 Respirable Particulate Matter (Size less than 10µm) (RPM) Annual Average* 120 µg/m3 60 µg/m3 50 µg/m3 Respirable Particulate Matter Sampler 24 Hours Average** 150 µg/m3 100 µg/m3 75 µg/m3 Lead (Pb) Annual Average* 1.0 µg/m3 0.75 µg/m3 0.50 µg/m3 AAS Method after sampling using EPM 2000 or equivalent filter paper 24 Hour Average** 1.5 µg/m3 1.0 µg/m3 0.75 µg/m3 Carbon Monoxide (CO) 8 Hours Average** 5.0 mg/m3 2.0 mg/m3 1.0 mg/m3 Non dispersive Infrared Spectroscopy 1 Hour Average 10.0mg/m3 4.0 mg/m3 2.0 mg/m3 Ammonia (NH3) Annual Average* 0.1 mg/m3 - 24 Hour Average** 0.4 mg/m3 * Annual Arithmetic mean of minimum 104 measurements in a year twice a week 24 hourly at uniform interval. ** 24 hourly/8 hourly values should be met 98% of the time in a year. However, 2% of the time, it may exceed but not on two consecutive days. NOTE 1.National Ambient Air Quality Standard : The levels of air quality necessary with an adequate margin of safety, to protect the public health, vegetation and property. 2.Whenever and wherever two consecutive values exceed the limit specified above for the respective category, it would be considered adequate reason to institute regular/continuous monitoring and further investigations. 3.The State Government / State Board shall notify the sensitive and other areas in the respective states within a period of six months from the date of notification of National Ambient Air Quality Standards.
Sensitive Areas Sensitive area may include the following: 1) 10 kms all around the periphery of health resorts so notified by State Pollution Control Boards in consultation with department of public health of the concerned state. 2) 10 kms all around the periphery of biosphere reserves, sanctities and national parks, so notified by Ministry of Environment and Forest or concerned states. 3) 5 kms all around the periphery of an archeological monument declared to be of national importance or otherwise so notified A.S.I. in consultation with State Pollution Control Boards. 4) Areas where some delicate or sensitive to air pollution crops/important to the agriculture/horticulture of that area are grown so notified by State Pollution Control Boards in consultation with department of agriculture/horticulture of concerned state. 5) 5 kms around the periphery of centers of tourism and/or pilgrim due to their religious, historical, scenic or other attractions, so notified by department of tourism of the concerned state with State Pollution Control Boards.
National Air Quality Monitoring (NAQM) • Started in 1984 - 7 Station ( Manual Station) • By 2000 - Increased to 295 Stations (Operated and Maintained by SPCB /CPCB / Universities, etc. and funded by CPCB) • Monitoring in Delhi • 3 Continuous AQMS • 2 Mobile Vans • 6 Manual AQMS • 6 Integrated Air Quality Monitoring Station being set up • About 200 continuous stations maintained by large scale industries.
Air Quality Monitoring Parameters Monitored Criteria Pollutants SPM SO2 RSPM / PM10 NOx CO Pb Specific Pollutants Poly aromatic Hydrocarbons Benzene / Xylene / Toluene Ground level ozone(24 hourly, 8 hourly, 1 hourly)
Non-Attainment Areas Observed Annual Mean Concentration of a Criterion Pollutant Exceedence = ---------------------------------------------------------------- Factor Annual Standard for the Respective Pollutant and Area Class The Four Air Quality Categories are: • Critical Pollution (C): When EF is more than 1.5; • High Pollution (H): When EF is between 1.0 - 1.5; • Moderate Pollution (M): When EF is between 0.5 - 1.0; • Low Pollution (L): When the EF is less than 0.5.
Pollutants Industrial Residential L M H C L M H C Sulphur dioxide 98 % 2 % - - 98 % 2% - - Nitrogen dioxide 85 % 12% 3% - 70% 25% 5% - Respirable Suspended Particulate Matter 13 % 37% 28% 22% 2% 17% 28% 53% Suspended Particulate Matter 31% 46% 18% 2% 5% 17% 26% 52% Air Quality Status of IndiaDuring 2003
Major Initiatives Taken for Air Pollution Control in India(DURING LAST TWO DECADES) • Evolved National Ambient Air Quality Standards based on health impact (1982, 1994). • Emission standards for Air Polluting Industries developed for major industries. • Implementation of standards in 17 categories of Highly Polluting Industries and other small/medium scale industries (stone crushers, brick kiln, re-rolling mills, etc.). • Action Plan Implementation and Pollution Control in 24 problem areas. • Improvement in Vehicular Technology (Euro-I, Euro-II, CNG Vehicles, 4 stroke engines, etc.). • Improvement in Fuel quality - Diesel with low sulfur content (0.25 in whole country and 0.05 in Metro cities). • Gasoline - Lead Phased-out throughout the country from 1.2.2000.
Major Initiatives Taken for Air Pollution Control in India (DURING LAST TWO DECADES) • Pollution Under Control (PUC) certificate for all vehicles CNG - All commercial vehicles to operate on CNG in Delhi. • Coal beneficiation/clean coal technology –notification regarding use of beneficiated coal in T.P.P. • Pollution control in Taj Trapezium Zones (Natural gas to foundries, monitoring of air quality, etc.) • Air Quality Monitoring at National Level (295 stations spread over 93 cities). • Air Quality Index for public Information. • Air Quality Data on TV channels and daily news papers for Public awareness.
Achievements in Air Pollution Control in Coal Based Thermal Power Plants • Promotion of clean coal technologies such FBC and Supercritical boilers (reduction of GHG) for power generation. Installation of Electrostatic Precipitators in place of M.D.C. Adoption alternate ash disposal systems such Dry disposal/ MCSD/HCSD Use of beneficiated coal in Power Station located in critically polluted areas Utilisation of flyash (Nil to 26%)
Achievements in Air Pollution Control in Cement Plants • Installation of Electrostatic Precipitators/ Bag Filters in place of MDC • Production of Portland Pozzolana Cement using Flyash and Blast Furnace Slag • Exploring possibilities for utilisation of High Calorific Hazardous Waste as fuel in Cement kiln • Good Practices for fugitive emission control
Achievements in Air Pollution Control From Oil Refineries Oil Refineries in India: Overview • 17 petroleum refineries of various size, age and product ranges having crude throughput capacity of about 123 Million Metric Tonnes per Annum (MMTPA) • Smallest (Digboi – 0.65 MMTPA) and largest (Jamnagar – 27 MMTPA) operating refinery in the world • Phenomenal growth – Refining capacity increased from 30 MMTPA in 1980 to 123 MMTPA in 2004 • Technological upgradation in refining processes during the last decade for providing improved fuel quality (Hydro desulphurization unit, unleaded petrol, low Benzene Petrol etc.)
Achievements in Air Pollution Control from Oil Refineries Existing Pollution Control Scenario • Emission standards (notified in 1986) cover emissions of Sulphur Dioxide (SO2) only • Refineries emit about 175 tonnes / day of SO2 • Minimizing SO2 emissions – Option in use are: (i) Blending of crude; (ii) Use of low sulphur fuels; (iii) High efficiency SRU (+99%); and (iv) Adequate Stack Height Recent Initiatives • Emission standards being revised to include additional parameters viz. NOx and VOCs, Leak Detection and Repair (LDAR) programme being incorporated to reduce fugitive emissions of VOCs. • Continuous improvement in the fuel quality (Sulphur in diesel 2500 ppm to 350 ppm) • Improvement beyond regulatory compliance (CREP)
Road Map for Industrial Pollution Control(Formulation Of Charter On Corporate Responsibility For Environmental Protection For 17 Categories Of Industries) • Major Action Points: • Aluminium Industry • Revision of fluoride emission standard by Dec 2005 and 2010. • Phasing out of wet scrubbing system for fluoride by Dec 2006. • Allowing new potlines only with pre baked technology. • Cement Industry • Augmentation of existing pollution control devices. • Plant located in critically polluted areas or urban areas to meet PM emission standard of 100mg/m3 Load based standard for Cement Kiln.
Road Map for Industrial Pollution Control(Formulation Of Charter On Corporate Responsibility For Environmental Protection For 17 Categories Of Industries) • Major Action Points: • Chlor- Alkali Industry • Total mercury released to environment at 2gm/t of product by Dec2005 • Switch over to membrane cell technology in a time bound manner. • Copper Industry • To meet SO2 emission limit (2kg/tonne of H2SO4 produced). 50 mg/Nm3 of acid mist by December 2005. • Dyes & Dye intermediates • Minimisation of loss of VOC ( Solvent recovery of at least 90%) • Scrubbing system for SO2 & NOx emissions to be upgraded by July 2003
Road Map for Industrial Pollution Control(Formulation Of Charter On Corporate Responsibility For Environmental Protection For 17 Categories Of Industries) • Fertilizer Industry: • All upcoming urea plant to have urea prilling towers based on natural draft to minimize urea dust emission. • The existing urea plants with forced draft prilling towers will have to install appropriate dust control system by June 2003. • Sulphuric acid plants SCSA system to DCDA system by march 2004. • Integrated Iron & Steel: • Reducing fugitive emissions in coke oven plants & steel melting shop by December 2005 & March 2008 respectively. • Direct injection of reducing agent in blast furnace. • Oil refineries: • All refineries located in critically polluted areas to submit action plan for phase wise reduction of SO2 emission. • Future refineries to have sulphur recovery units with minimum 99 % efficiency . • New refineries to install low NOx burners.
Road Map for Industrial Pollution Control(Formulation Of Charter On Corporate Responsibility For Environmental Protection For 17 Categories Of Industries) • Pesticide Industry: • For air pollution control from process , scrubber efficiency to be more than 90%. • Industry to adopt standard engineering practices for control of fugitive emissions. • Hazardous waste Incinerators to be upgraded to meet CPCB norms. • Petro- Chemicals Industry • Action Plan to be submitted for improving thermal efficiency 7 Control of NOx and handling of halogenated organics. • Fugitive emissions of carcinogenic compounds to be controlled by closed vapours collection & recovery system.
Road Map for Industrial Pollution Control(Formulation Of Charter On Corporate Responsibility For Environmental Protection For 17 Categories Of Industries) • Pharmaceuticals Industry • Control of hazardous air pollutants & odorous compounds by Dec 2004. • Pulp & Paper Industry: • Installation of odor control system within four yrs. • Sugar Industry: • To install ESP/ bag filter/ high efficiency scrubber to comply with standard of 150 mg/nm3.
Road Map for Industrial Pollution Control(Formulation Of Charter On Corporate Responsibility For Environmental Protection For 17 Categories Of Industries) • Thermal Power Plants: • Implementation of environmental standards in non- compliant power plants by Dec 2005. • New/ Expansions power plants to meet PM standard of 100 mg/nm3 . • Development of SO2 , NOx, mercury &other toxic heavy metal emission standard by Dec 2005 • Review of stack height requirement based on micro metrological data. • Zinc Industry: • Meeting SO2 emission limit ( 2 kg/tonne of H2SO4 produced), 50 mg/nm3 of acid mist by Dec 2006.
New Vehicles Vehicular technology: Upgrade Vehicular technology to meet stricter emission norms. Fuel quality: Improvement in the fuel quality to meet stricter emission norms and meet with vehicular technology. Alternate Fuels: Use of Alternate fuels like CNG/LPG/ Battery etc. Measures for Controlling Vehicular Pollution