Download
1 / 14
140 likes | 237 Vues
LAB 4. NEGLECT AS A CHILD AND DATING PARTNER VIOLENCE. “Macro” level research. Also called “societal level” research if the units are societies. Previous lab used a single question to measure corporal punishment. This lab uses a scale created from 8 questions

E N D
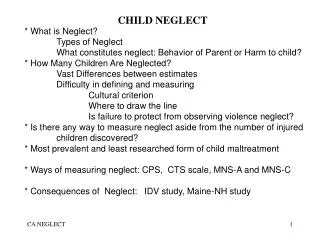
LAB 4. NEGLECT AS A CHILD AND DATING PARTNER VIOLENCE • “Macro” level research. Also called “societal level” research if the units are societies. • Previous lab used a single question to measure corporal punishment. This lab uses a scale created from 8 questions • Illustrates why it is crucial to measure neglect by behavior of parents, not by injury to the child • The Research Questions • 1. How prevalent is neglect? • 2. How much does it vary from nation to nation? • 3. In nations where neglect is more common, do a larger percent of students assault a dating partner? • Write your hypothesis about question 3 on the Lab Report Form
MEASUREMENT USING A SCALECOMPARED TO A SINGLE QUESTION Previous lab used a single question to measure corporal punishment. This lab uses a scale created from 8 questions ADVANTAGES OF A SCALE Gets at the multiple aspects of a phenomenon More accurate measurement because it does not depend on just one observation. One observation may be wrong, but not all 8.
MULTIDIMENSIONAL NEGLECT SCALESHORT FORM (Form MNS-AS) • Cognitive needs • My parents helped me with homework if I needed help (R) • My parents did not help me to do my best in school • Educational Needs • My parents made sure I went to school (R) • My parents did not care if I got into trouble in school • Emotional needs • My parents helped me when I had problems (R) • My parents did not comfort me when I was upset • Physical needs • My parents gave me enough clothes to keep me warm (R) • My parents did not keep me clean • (R) = REVERSED ITEMS
MEASURING NEGLECT ENTIRELY ON THE BASIS OFBEHAVIOR OF THE CARE-GIVER Illustrates one of the reasons why it is crucial to measure neglect by behavior of parents, not by injury to the child. The injuries from neglect are usually psychological, and difficult or impossible to see: Slowdown in cognitive development Lowered ability to form attachments to other Depression as child or adult Some severe enough to be visible, but most not If seen, observer cannot attribute it to the neglect. It could be due to any one or more of many other causes. Only research can establish if there is a link to neglect, and then only on a statisical average basis – as a "risk factor." Example in this lab: Violence against a dating partner
SAMPLE AND MEASURES SAMPLE: 26 Universities in 14 countries INDEPENDENT VARIABLE: Enter what the variable is on the lab report. DEPENDENT VARIABLE Enter this on the lab report.
LOCATING THE VARIABLESON THE CODE AND THE DATA SHEET For the lab after this one, I will ask you to do this. Neglect History Two versions of the scale NHT1_1 = one or more of the eight acts of neglect NHT1_2 = three or more of the eight acts of neglect Which is better for this reserarch? Assauling A Dating Partner We will use the Severe assault measure Focuses the research on a serious crime and one that of injurs students. Not just "lovers quarells" See next slide .
CTS Physical Assault Scale Minor Physical Assault: ·Threw something at partner that could hurt ·Twisted my partner’s arm or hair ·Pushed or shoved my partner ·Grabbed my partner ·Slapped my partner Severe Physical Assault: ·Used knife or gun on partner on my partner ·Punched or hit my partner with something that could hurt ·Choked my partner ·Slammed my partner against a wall ·Beat up my partner ·Burned or scalded my partner ·Kicked my partner coefficient of reliability = .86.
The X axis (horizontal axis) variable is the percent in each site who experienced 3 or more acts of neglect • NHT1_2 in 3rd row from bottom, left side • The Y axis (vertical axis) variable is the percent in each site who severely assaulted a dating partner. • CTASSP_1 in first row, right side • Variable - row 1 of the data sheet, next to last box • Each of you will have a data sheet for one or two of the sites. • We will go around the class and each of you will read out the value for the X variable and then for the Y variable from your data sheet • As each pair of scores is read out, everyone will put a large dot in the cell of the table that corresponds to that combination of scores. SCATTER PLOT TO TEST THE HYPOTHESIS
FITTING A TREND LINE TO SHOW THERELATION BETWEEN THE PREVALENCE OF CORPORAL PUNISHMENT IN A COUNTRY AND THE PREVALENCE OF ASSAULTING A DATING PARTNER • Inspect each column of the graph and circle the dot that represents the average of the dots in that column. This will usually be the middle dot • Use a streight edge and draw a line to connect each circled dot to the next one to the right. • When this line is fitted mathematically it is called a “regression line” The computer will also give you a correlation or regression coefficient that indicates how good the fit is between the dots and the line. • Regression line when r = 1.00, r = .00, and r = .50 (next slide)
Table 5a: Neglect Total Scores in Rank Order by Site, by Gender
RESULTS AND DISCUSSION SECTION OF THE LAB REPORT • RESULTS SECTION • How much neglect was there? How much did it vary from university to university? • How much severe violence to partners was there? How much did it vary from university to university? • What is the relation of having been neglected to severly attacking a dating partner? State this using the following format: • The more …X…., the more …Y…. (or can be "the less Y) • Where X = the independent variable, Y = the dependent variable • How close a relationship is there? • Anything else you noticed about the results? • DISCUSSION SECTION (answer either or both) • What processes could produces this relationship? • What do the results suggest concerning social policy?
WHAT HAS BEEN LEARNED FROM THIS LAB? • RESULTS • THE PREVALENCE OF NEGLECT WORLD-WIDE • THE PREVALENCE OF SEVERE VIOLENCE AGAINST DATING PARTNERS BY UNIVERSITY STUDENTS WORLD-WIDE • WHETHER NEGLECT IS RELATED TO HOW VIOLENT A COUNTRY IS (MORE ACCURATELY, "STUDENTS AT UNIVERSITIES IN VARIOUS COUNTRIES") • METHODS • HOW A SCATTER PLOT CAN BE USED TO TEST A HYPOTHESIS • AN UNDERSTANDING OF THE FOLLOWING RESEARCH TOOLS: • Regression line • Correlation or regression coefficient • Test of significance • AN EXPERIENCE WITH EVALUATING DATA AND INTERPRETING RESULTS