Download
1 / 12
120 likes | 348 Vues
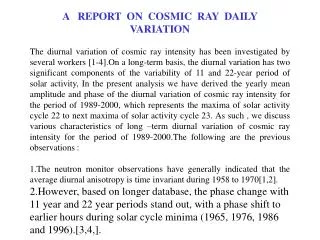
Seasonal variations of diurnal variation of cosmic-ray muon intensit y in Belgrade. A. Dragi ć, D. Joković, R. Banjanac, V. Udovičić, J. Aleksi ć * , J. Puzović* and I. V. Aničin* Institute of Physics, Belgrade, Serbia , *Faculty of Physics, University of Belgrade, Belgrade, Serbia.

E N D
Seasonal variations of diurnal variation of cosmic-ray muon intensity in Belgrade A. Dragić, D. Joković, R. Banjanac, V. Udovičić, J. Aleksić*, J. Puzović* and I.V. Aničin* Institute of Physics, Belgrade, Serbia, *Faculty of Physics, University of Belgrade, Belgrade, Serbia
The cosmic-ray muon flux is measured at five minute intervals in both the ground level (78 m a.s.l.) and underground (25 mwe) laboratories in Belgrade (~45 deg N, 20 deg E), during the years 2002 to 2004, in the descending phase of solar cycle 23
The 5 min spectra and hourly time series for the ground detector look like this
And, after cleaning-up the incomplete data and non-periodic events, the frequency count in the remaining complete 400 days is (astonishingly?) a nice Gaussian, but wider than it would have been if the count was stationary. The integral of the distribution is therefore a good measure of the total average muon flux (the result still to be extracted)
This is how an average day (from about thirty days with clean data) in average February (from three consecutive years) looks like
And this is the look of the average day throughout the months of the average year
These are the amplitudes and phases of 24 and 12 hour harmonics (also found in the periodogram analysis of the whole series), satisfactorily fitted through every average month’s data, for the ground detector
And this is a harmonic function with a period of roughly 6 months, fitted through the amplitudes of the 24 hour harmonic for the whole average year (also suggested to exist by the periodogram analysis of the whole series)
Maxima of this seasonal variation of the amplitude of the 24 hour harmonic are at solstices and minima are at equinoxes,butfor the underground detectorseasonal variations are, within our (poor) statistical accuracy, absent (next and final slide)