Network Tomography Based on Flow Level Measurements
250 likes | 271 Vues
This research delves into inferring network resource sharing through flow level measurements and correlation analyses, aiding network management and troubleshooting. The methodology involves flow sampling, dimensionality reduction, and factor analysis. The study validates the approach using real TCP flow data from UT Austin.

Network Tomography Based on Flow Level Measurements
E N D
Presentation Transcript
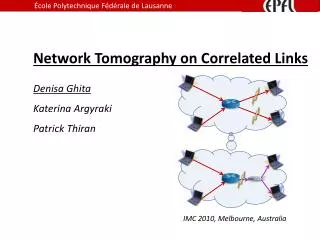
Network Tomography Based on Flow Level Measurements Dogu Arifler, Gustavo de Veciana, and Brian L. Evans The University of Texas at Austin IEEE International Conference on Acoustics, Speech, and Signal Processing Montréal, Canada,May 18, 2004 http://www.wncg.org http://www.ece.utexas.edu
Outline • Introduction • Motivation for inferring network resource sharing • Flow level measurements • Methodology for inferring network resource sharing • Sampling of flow class throughput processes • Dimensionality reduction • Validation with measured data • TCP measurements from UT Austin’s border router • Statistical accuracy of estimates • Conclusion
Inference of congested resource sharing • Motivation: Network managers need information about resource sharing in other networks to better plan for services and diagnose performance problems • Internet service providers need todiagnose configuration errors and link failures in peer networks • Content providers need to balance workload and plan cache placement • Problem: In general, properties of networks outside one’s administrative domain are unknown • Little or no information on routing, topology, or link utilizations • Solution: Network tomography • Inferring characteristics of networks from available network traffic measurements
Network tomography • Previous work based on packet level measurements • Correlation of end-to-end packet losses and delays[Rubenstein, Kurose & Towsley, 2002] • Inspection of arrival order of packets using probe packets[Rabbat, Nowak & Coates, 2002] • Data intensive to collect and store each packet • Complex to analyze: high variability over different time scales[Feldmann, Gilbert, Huang & Willinger, 2002] • Propose to use flow level measurements • A flow is a sequence of packets associated with a given instance of an application [IETF RFC #2722, 1999] • Packets composing a flow correspond to transfer of a Web page, a file, an e-mail message, etc. • Passive flow level measurements available at local site
Records Data warehouse Monitored link Flow level measurements • Flow records • Provide summary information • Easier to collect and store • Collected by networking equipment(e.g. Cisco NetFlow, sFlow, Argus) • Flow records contain • Source/destination IP addresses, port numbers, number of packets and bytes in flow, and start and end time of flow • ~80% of Internet flows are TCP flows [http://www.caida.org] timeout response time identifier 1 time identifier 2 start time packets of a flow end time
available capacity flow 1 flow 2 time TCP flows • TCP adapts its data transmission rate to available network capacity • Congested link bandwidth sharing is roughly fair for flows that have similar packet loss rates and roundtrip times • Correlated link bandwidth allocation among flows results in correlated flow performance measures • TCP flow performance measure: perceived throughput • Amount of data in bytes (flow size) divided by response time • Premise: Throughputs of TCP flows that temporally overlap at a congested resource are correlated
Throughput of a flow class • Flow class is a collection of flow records that have a common identifier, e.g. source/destination address • How can one infer which flow classes share resources? • Correlate flow class throughput processes given by class 1 Flow records collected at a measurement site . . . . . . class 2 time
time consider red and blue classes Conditional sampling of random processes • Which flow class throughput samples can be used to capture flow class throughput correlations? • Construct correlation matrix R of pairwise correlations • Estimate throughput correlation between class pairs by using class throughput samples at times when flow class pair is active • N(T) number of discrete intervals over which ciand cj are active Example activity of flow classes for discrete time index n
Exploratory factor analysis • Correlation structure captured by few latent factors • Orthogonal factor model • p flow classes and m factors where m≤ p • Λij are loadings (or weights) of each factor Fi on a variable • EstimateΛand using principal components analysis • m determined by H. F. Kaiser’s rule [1960]: Principal components whose variances are greater than 1 are significant factors
Inference of resource sharing 1 2 3 4 5 Source 1 2 3 4 5 Destination • Consider five flow classes with two significant factors identified Factor 1 Factor 2 Class 1 • Factor loading with largest magnitudein each row is boxed Class 2 • Classes 1, 2 and 5 share one resource • Classes 3 & 4 share another resource Class 3 Class 4 • Paper validates approach usingknown distributions of flow sizesand flow arrivals for two topologies Class 5
Measured data: preprocessing • Two NetFlow datasets from UT Austin’s border router • Assume that traffic is stationary over one-hour periods • Choose two incoming flow classes that are very likely to experience congestion at the server • Select IP addresses associated with AOL and HotMail • Divide each class into two: AOL1, AOL2 and HotMail1, HotMail2 • Filter flow records based on • Packets: Discard flows consisting of only 1 packet • Duration: Discard flows with duration shorter than 1 second • Size: Discard flows with sizes < 8 kB or > 64 kB
Measured data: component variances • Parent class (AOL and HotMail) throughput correlation is -0.07 for Dataset2002 and 0.05 for Dataset2004 • 95% bootstrap confidence intervals of variances of principal components of 4 classes AOL1, AOL2, HotMail1, and HotMail2 given below • 2 significant factors have explanatory power of 72% for Dataset2002 and 63% for Dataset2004
Dataset2002 Dataset2004 AOL1 AOL2 HotMail1 Hotmail2 AOL1 AOL2 HotMail1 Hotmail2 Measured data: factor loadings • Based on 2 significant factors, determine factor loadings • Rotated factor loading estimates • Rows correspond to classes • Columns correspond to shared infrastructure • Estimate 95% bootstrap confidence intervals for loadings to establish accuracy† • With 95% confidence, we can identify which flow classes share infrastructure † Dogu Arifler, Network Tomography Based on Flow Level Measurements, Ph.D. Dissertation, 2004.
Conclusion • Contributions • Application of a structural analysis technique, factor analysis, to explore network properties • Methodology for inferring resource sharing • Use of bootstrap methods to make inferential statements about resource sharing • Possible applications • Network monitoring and root cause analysis of poor performance • Problem diagnosis and off-line evaluation of congestion status of networks • Route configuration by Internet service providers
Flow level performance of elastic traffic • Elastic traffic can tolerate rate variations • This implies that a closed-loop control, such as TCP, can be applied end-to-end on flows • Additive increase, multiplicative decrease congestion avoidance algorithm of TCP • The transmission rate increases linearly in the absence of packet loss, and is halved when there is packet loss • For a given RTT and loss rate p, flow throughput is: • Also, this relates p to throughput • However, y(p) depends on number of flows in progress • Packet level dynamics is determined by flow level dynamics
Notes on processor sharing • When there are n customers in the system, each receive service at a rate 1/n sec/sec • All customers are sharing the capacity equally • Two abstractions: • Customers are given the full capacity on a part-time basis • Customers are given a fractional-capacity on a full-time basis • Why does TCP realize processor sharing? • When there are n flows in the single-bottleneck system, the protocol tends to share bandwidth roughly equally among flows (for flows with similar RTTs and packet loss rates). This is processor sharing! • More generally, TCP’s additive-increase/multiplicative-decrease (AIMD) achieves fair sharing [Massoulie and Roberts, 2002]
Notes on factor analysis • Factor analysis vs. principal component analysis (PCA) • In factor analysis, primary goal is to explain correlations between variables (off-diagonal elements of covariance/correlation matrix) • In PCA, primary goal is to explain variance (diagonal elements of covariance/correlation matrix) • PCA is usually used to find initial estimates of loadings • Another related method: independent component analysis; looks at higher order moments • How do temporal correlations within a class’ throughput affect factor analysis? • Ignore serial correlations when the interest is descriptive or exploratory in nature • Successfully applied to econometric time series, biometric time series, etc. • See e.g., Basilevsky 1993 or Jolliffe 2002
Interaction of coupled traffic • Consider a “linear” network to evaluate the effect of interactions of coupled network traffic • Can throughputs of two flow classes that do not share a link be correlated due to interactions through another flow class? • Results of fluid simulations show that degree of correlation between throughputs of classes not sharing a link is negligible file server 1 1 2 file server 3 3 file server 2 10 Mbps LANs with 10 workstations
file server 1 (20%) 80% 80% 1 Background traffic utilizes 20% of bottleneck links 2 file server 3 (40%) 3 file server 2 (40%) 10 Mbps LANs with 10 workstations Interaction of coupled traffic: an example • Consider the “linear” network below • Discard flows with sizes < 4 kB or > 32 kB • Based on 2 significant factors, determine factor loadings • Rotated factor loading estimates • Rows correspond to classes • Columns correspond to shared links
Validation with real data is extremely difficult! Unlike controlled simulations, we do not know routing information We would like to be able to make inferential statements Estimate 95% confidence intervals for eigenvalues and loadings Modify Kaiser’s rule for selecting significant eigenvalues The bootstrap, a computer-based method, can be used to compute confidence intervals[Efron and Tibshirani, 1993] From data at hand, construct empirical distribution and generate many realizations No distributional assumptionson data required Applicable to any statistic, s(X), simple or complicated samples of size n (B independent replications) The bootstrap
Principal component method • Use spectral decomposition on R to estimate Λand • Eigenvalue-eigenvector pairs (i, ξi), 1 ≤ i ≤ p • Determine m “significant”eigenvalues of R using Kaiser’s rule [Kaiser, 1960] • Variances of factors are given by eigenvalues m significant eigenvalues variance of a normalized variable eigenvalue 1 … 1 2 3 4 5 6 7 where
Summary of methodology Flow filtering Conditional sampling Network tomography Bootstrap Exploratory factor analysis