Understanding UML: Diagrams for Object-Oriented Analysis and Design
Unified Modeling Language (UML) offers a standardized set of diagrams that capture various aspects of software design. Each diagram, such as Class, Sequence, and Statechart diagrams, provides unique perspectives, akin to blueprints of a building. They collectively illustrate how components interact, the flow of processes, and system behavior. UML facilitates clear communication among developers, enabling them to visualize alternative designs and enhance collaboration across teams. This structured approach simplifies the complexity of software design and enhances the understanding of system functionalities.

Understanding UML: Diagrams for Object-Oriented Analysis and Design
E N D
Presentation Transcript
Object Oriented Analysis and Design Unified Modeling Language
Unified Modeling Language • A series of diagrams to capture software design • Each diagram shows a different aspect of the design • You cannot see an entire program • In just one diagram • In just one type of diagram • Each diagram provides a different view of the game • All of the diagrams show you how the game will work
Multiple Views, Like Blueprints Each diagram shows the object from one perspective
Multiple Views, Like Blueprints Another view lets you build a 3D image of the object
Multiple Views, Like Blueprints A third view completes the 3D picture of the object
Multiple Views, Like Blueprints Other diagrams can zoom in to show details
Alternate Designs to One Problem Other studios might design different solutions to the same problem
Nothing New Under the Sun • UML simplifies formalizes the diagrams used for years • We now • Have a standard set of symbols • Have a standard set of diagrams • Have tools to support diagram production • Allow the designs to be understood by everyone
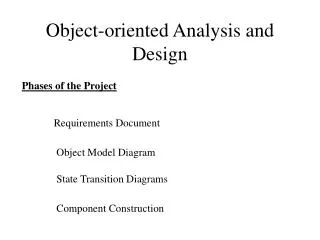
Class Diagram • Shows some or all of the classes in the program • Shows how the classes are related to one another via inheritance • Shows other relationships between classes
Object Diagram • Shows the actual connection between objects • It is like a snapshot of the connection between objects in the running system • Used to illustrate how class instances are actually connected to each other
Activity Diagram • An activity diagram shows the series of steps necessary to complete an operation • An activity diagram can include • Linear control flow • Decision points • Splitting of control for parallel execution • Joining of parallel threads of control
Sequence Diagram • A sequence diagram shows the method calls between objects • These are arranged along vertical time lines • Can include self-referential calls for methods performed by the same object
Collaboration Diagram • The collaboration diagram shows how objects interact to perform a task • It is similar to a sequence diagram but does not use an explicit time line • As a result, messages between the objects are numbered to show their sequence
Statechart Diagram • Shows how the system moves between several states • Shows the events or inputs that cause the transition from one state to the next • Useful for formally specifying the behaviour of a system
Package Diagrams • In large systems, it is helpful to group related classes together into packages • This helps to organize the classes into logical units • A package diagram shows the packages and what classes are within the package
Deployment Diagram • The deployment diagram shows how the software will be deployed on the hardware • It consists of hardware nodes that can run software and software nodes which are environments in which software can run
Component Diagrams • Show interaction between the components of the system • Can be used to identify related components or reuseable components • Components can be objects or other entities, such as files, in the system
Views • A single picture does not convey all there is to know about a piece of software • Different diagrams show different aspects of the software, just like blueprints show different aspects of a house • Views provide a way to organize software diagrams into groups
Views • We use three views • Functional view • Shows the functional behavior of the system from a requirements point of view • Static view • Shows a static snapshot of the components of the design of the final solution • Dynamic view • Shows how the design components interact to solve the problem