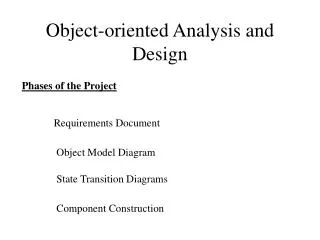
Object Oriented Analysis and Design
Object Oriented Analysis and Design. CSCU 411 Chapter 12. Unified Modeling Language (UML). http://www.uml.org/. http://www.holub.com/goodies/uml/. http://en.wikipedia.org/wiki/Unified_Modeling_Language. Goals of UML. The primary goals in the design of the UML were:

Object Oriented Analysis and Design
E N D
Presentation Transcript
Object Oriented Analysis and Design CSCU 411 Chapter 12
Unified Modeling Language (UML) http://www.uml.org/ http://www.holub.com/goodies/uml/ http://en.wikipedia.org/wiki/Unified_Modeling_Language
Goals of UML • The primary goals in the design of the UML were: • Provide users with a ready-to-use, expressive visual modeling language so they can develop and exchange meaningful models. • Provide extensibility and specialization mechanisms to extend the core concepts. • Be independent of particular programming languages and development processes. • Provide a formal basis for understanding the modeling language. • Encourage the growth of the OO tools market. • Support higher-level development concepts such as collaborations, frameworks, patterns and components. • Integrate best practices.
Why Use UML? • As the strategic value of software increases for many companies, the industry looks for techniques to automate the production of software and to improve quality and reduce cost and time-to-market. These techniques include component technology, visual programming, patterns and frameworks. Businesses also seek techniques to manage the complexity of systems as they increase in scope and scale. In particular, they recognize the need to solve recurring architectural problems, such as physical distribution, concurrency, replication, security, load balancing and fault tolerance. Additionally, the development for the World Wide Web, while making some things simpler, has exacerbated these architectural problems. The Unified Modeling Language (UML) was designed to respond to these needs.
Class Diagrams • Class diagrams are widely used to describe the types of objects in a system and their relationships. Class diagrams model class structure and contents using design elements such as classes, packages and objects.2 Class diagrams describe three different perspectives when designing a system, conceptual, specification, and implementation.1 These perspectives become evident as the diagram is created and help solidify the design. This example is only meant as an introduction to the UML and class diagrams. If you would like to learn more see the Resources page for more detailed resources on UML. • Classes are composed of three things: a name, attributes, and operations. Below is an example of a class.
Class Diagrams • Class diagrams also display relationships such as containment, inheritance, associations and others. Below is an example of an associative relationship:
Interaction Diagrams • Sequence diagrams: • Sequence diagrams demonstrate the behavior of objects in a use case by describing the objects and the messages they pass. the diagrams are read left to right and descending. The example below shows an object of class 1 start the behavior by sending a message to an object of class 2. Messages pass between the different objects until the object of class 1 receives the final message.
Sequence diagrams • Below is a slightly more complex example. The light blue vertical rectangles the objects activation while the green vertical dashed lines represent the life of the object. The green vertical rectangles represent when a particular object has control. The represents when the object is destroyed. This diagrams also shows conditions for messages to be sent to other object. The condition is listed between brackets next to the message. For example, a [condition] has to be met before the object of class 2 can send a message() to the object of class 3.
Collaboration diagrams • Collaboration diagrams are also relatively easy to draw. They show the relationship between objects and the order of messages passed between them. The objects are listed as icons and arrows indicate the messages being passed between them. The numbers next to the messages are called sequence numbers. As the name suggests, they show the sequence of the messages as they are passed between the objects. There are many acceptable sequence numbering schemes in UML. A simple 1, 2, 3... format can be used, as the example below shows, or for more detailed and complex diagrams a 1, 1.1 ,1.2, 1.2.1... scheme can be used.
Collaboration diagrams • The example below shows a simple collaboration diagram for the placing an order use case. This time the names of the objects appear after the colon, such as :Order Entry Window following the objectName:className naming convention. This time the class name is shown to demonstrate that all of objects of that class will behave the same way.
State Diagrams • State diagrams are used to describe the behavior of a system. State diagrams describe all of the possible states of an object as events occur. Each diagram usually represents objects of a single class and track the different states of its objects through the system.
State Diagrams • State diagrams can also show a super-state for the object. A super-state is used when many transitions lead to the a certain state. Instead of showing all of the transitions from each state to the redundant state a super-state can be used to show that all of the states inside of the super-state can transition to the redundant state. This helps make the state diagram easier to read. • The diagram below shows a super-state. Both the Checking and Dispatching states can transition into the Canceled state, so a transition is shown from a super-state named Active to the state Cancel. By contrast, the state Dispatching can only transition to the Delivered state, so we show an arrow only from the Dispatching state to the Delivered state.
Activity Diagrams • Activity diagrams describe the workflow behavior of a system. Activity diagrams are similar to state diagrams because activities are the state of doing something. The diagrams describe the state of activities by showing the sequence of activities performed. Activity diagrams can show activities that are conditional or parallel.
Physical Diagrams • There are two types of physical diagrams: deployment diagrams and component diagrams. Deployment diagrams show the physical relationship between hardware and software in a system. Component diagrams show the software components of a system and how they are related to each other. These relationships are called dependencies.
CRC (Class-Responsibility-Collaboration) diagrams • One of the most valuable techniques in coming up with a good OO design is to explore object interactions, because it focuses on behavior rather than data. • CRC (Class-Responsibility-Collaboration) diagrams, invented by Ward Cunningham in the late 1980s, have stood the test of time as a highly effective way to do this . • Although they aren’t part of the UML, they are a very popular technique among skilled object designers.
CRC Cards The biggest mistake you can make is overcomplicating CRC cards. They are best used for a rough design before you move on to UML. Typically everyone has a slightly different picture of the project and that is why it is important to get a design on paper for group members to fall back on.
The Booch Method • The Booch Method is a well-documented, proven method for object-oriented analysis and design. It has gone through two major revisions, and is currently being updated a third time to reflect the experience gained with the method over the last five+ years. • The Booch method is a technique used in software engineering. It is an object modeling language and methodology that was widely used in object-oriented analysis and design. It was developed by Grady Booch while at Rational Software (now part of IBM). • The notation aspect of the Booch method has now been superseded by the Unified Modeling Language (UML), which features graphical elements from the Booch method along with elements from the object-modeling technique (OMT) and object-oriented software engineering (OOSE).
Booch Method • What makes the Booch Method different? • The Booch method notation differs from other OO methodologies because it centers on the development of four fundamental models of the system in the problem domain that will be implemented primarily in software. These models are: • The Logical Model • The Physical Model • The Static Model • The Dynamic Model • These models document components: classes, class categories, objects, operations, subsystems, modules, processes, processors, devices and the relationships between them. Just as an architect has multiple views of a skyscraper under construction, so the software engineer has multiple view of the software system undergoing design.
Object-modeling technique • The object-modeling technique (OMT) is an object modeling language for software modeling and designing. It was developed circa 1991 by Rumbaugh, Blaha, Premerlani, Eddy and Lorensen as a method to develop object-oriented systems, and to support object-oriented programming. • OMT is a predecessor to the Unified Modeling Language (UML). Many OMT modeling elements are common to UML.
Object-modeling technique • OMT object diagram
Object-modeling technique • OMT State Diagram
Fusion Object-Oriented Development • This O-O methodology is documented in Object-oriented Development The Fusion Method by Derek Coleman et al [Coleman-93]. • The Fusion Method consists of an analysis phase and a design phase. Analysis has the object model and interface model. Design has the object interaction graph, visibility graph, inheritance graph, and class description.
Object Oriented Metrics • Metrics for OO Software Development Environments • Methods per Class • Inheritance Dependencies • Degree of Coupling Between Objects • Degree of Cohesion of Objects • Object Library Effectiveness • Factoring Effectiveness • Degree of Reuse of Inheritance Methods • Average Method Complexity • Application Granularity • Formulas http://yunus.hun.edu.tr/~sencer/oom.html