Approaches to Paleoceanography
620 likes | 840 Vues
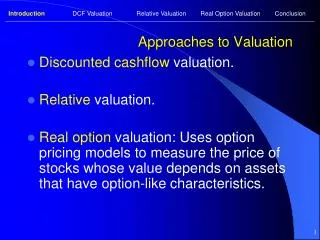
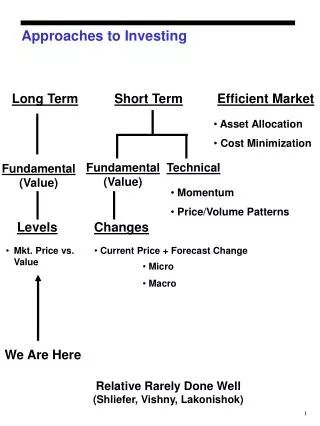
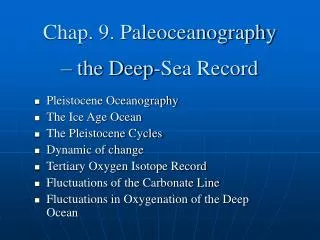
Approaches to Paleoceanography. Materials. Retrieval of Sediments Piston cores Drilling. Piston Cores A Core a Dad keeps Doc Away. Piston Cores. Piston Cores. Gravity Cores. Ocean Drilling Program. Ocean Drilling Program Cores. Ice Rafted Detritus.

Approaches to Paleoceanography
E N D
Presentation Transcript
Materials • Retrieval of Sediments • Piston cores • Drilling
Ice Rafted Detritus A sample of ice-rafted debris (IRD), or sediment. The individual grains of microscopic-size debris are counted to obtain the percentage of grains in a gram of sediment. The percentage varies when ice-rafting increases or decreases, or if the number of organisms increase or decrease.
Ice Rafted Detritus There is historical documentation of many sightings of icebergs far south from their usual waters. Patterns of cooling and warming climate can be determined by looking at the sediment transported by those icebergs. By following the boundaries and tracks of icebergs we know how far ice could travel on ocean currents before they melted.
Ice Rafted Detritus Red dots mark location of sediment cores in this "study". Note how far south icebergs how been documented by navigators since 1890. The gray area marks areas of intense sightings. The location where the Titanic met an iceberg is just south of where core GGC-36 was taken (the raft marks the site).
Ice Bergs and Ice Rafted Detritus A source for volcanic glass in Iceland. This is the head of a fjord with basalt created by one of Iceland's many volcanic eruptions. When this fjord again becomes glaciated, the bergs that break off and float out to sea will be laden with volcanic debris.(Photo Rusty Lotti Bond, Deep-Sea Sample Repository, Lamont-Doherty Earth Observatory)
Ice Bergs and Ice Rafted Detritus Left: after a glacier has built up and chunks begin to break off and float out to sea. Right: A close-up where you can see the debris entrained in the iceberg. This debris will be different in icebergs from different places.(Photos Tom Lowell, Institute of Glacial Geology, University of Cincinnati)
Ice Bergs and Ice Rafted Detritus Geographic locations of "red beds", sources of hematite-stained grains, and sites of cores found with hematite-stained grains and basaltic (volcanic) glass. Arrows show ocean currents in which drifting icebergs would probable become entrained. Also shown on the map are known "red beds", the source of the hematite-stained grains.
Ice Bergs and Ice Rafted Detritus This core, taken on the Newfoundland Ridge, clearly displays the red hue of hematite-stain grains. This section of core is deep into the sediment and thus older in "time" than our discussion. This fact shows that transport of ice-rafted detritus is a process that is recorded back in time. The grains appear, then disappear in cycles.
Ice Bergs and Ice Rafted Detritus Volcanic glass and hematite-stained grains are two components of ice-rafted detritus. They are identified and counted with data produced in total numbers or percentages. Hematite is an iron mineral appearing in hues ranging from streel-gray or black, or cherry-red to reddish-brown. The distinctive reddish color in these cores makes it an excellent marker.
Ice Bergs and Ice Rafted Detritus Neogloboquadrina pachyderma (left), magnified at 400x. "N. pachy left" is a foraminifera that loves polar-like waters and is found today off east Greenland where summer temperatures are cold. Neogloboquadrina pachyderma (right coiling) magnified at 400x. This "right coiling" N. pachyderma favors warmer subpolar water.
Ice Bergs and Ice Rafted Detritus Neogloboquadrina pachyderma (left), magnified at 400x. "N. pachy left" is a foraminifera that loves polar-like waters and is found today off east Greenland where summer temperatures are cold. Neogloboquadrina pachyderma (right coiling) magnified at 400x. This "right coiling" N. pachyderma favors warmer subpolar water.
Ocean Chemistry • Many of the modern circulation patterns are reflected in chemical variations. We have talked about stable carbon reflecting nutrient profiles and stable oxygen isotopes reflecting temperature and ice volume changes.
Oxygen Isotopes and ClimateReconstructing Temperatures and Ice Volumes
Stable Oxygen Isotopes • Paleo-temperature Equation T°C = 16.9-4.2*(18OCaCO3- 18Owater )+0.1*(18OCaCO3- 18Owater )2
Stable Oxygen Isotopes Changes in 18Ocalcite 18Ocalcite = -0.23 * T°C 18Ocalcite = d18Owater
The d18Owater Effect Ice Volume ~ 1‰ for 100 m of sea level equivalent
The 100,000 Year Cycle • The species composition and isotopic signature of deep-sea forams both showed 100,000 year periodicity. • Are the shorter-period oscillations of axial tilt and precession present? Imbrie and Imbrie, 1979
Here, on the Ontong-Java Plateau, the planktonic foraminiferal d18O values show a 1.2-1.3 ‰ amplitude, while the benthic foraminiferal d18O values show a 1.75 ‰ change. They though that this covariance of 1.2 ‰ meant that the "ice volume signal” is about 1.2 ‰. This is correct, although the assumption of constant equatorial sea surface temperatures (SST's) is being challenged
Fairbanks and Matthews (1978) studied uplift marine terrace from Barbados. Assumed constant uplift of terraces (Rendezvous Hill ~42 m/125 ka = 34 m/m.y.), dated them with Ur-Th uplifted terraces dated with 230Th give highstands: stages 5a, 5c, 5e, some stage 6 lowstand assumes uniform uplift rate in tectonically elevated regions: New Guinea + Barbados gives precise amplitude estimates of eustasy (sea level at 125 ka (stage 5e/5.5) was + 6m)
They measured the18O of corals and obtain a sea level/18O calibration of However, the amplitude of the sea level change from the last glacial maximum to now was not known until Fairbanks (1989) drilled the submarine terraces to get the 18 ka lowstand sea level/18O calibration 0.11‰/10 m
By sampling Acropora palmata (Elkhorn coral) in a series of borehole and dating this "fossil sunshine" (lives in < 5m water), Fairbanks obtained a sea level record for the last 18 k.y. LGM at 120 m ±5 m
Measure directly from atolls (Fairbanks, 1989, 1990) • Barbados lowstand • Acropora palmata (< 5m; fossil sunshine) found at 120 m below present day at 18k • 120 m ±5 m glacioeustatic lowstand predicts that G-I w change was 120 m *0.11‰/10 m = 1.3 ‰ this indicates that the deep sea was cooler by ~2°C during the last glacial 1.75-1.3 = 0.45‰ @ 0.22°/‰ = 2°C
Why not use the 18O record as a proxy for glacioeustasy • Wright, Miller, Sheridan, in prep. • The 18Orecord needs to be calibrated against independent sea-level estimates
The Carbon Isotope Proxy • Plants prefer to incorporate 12C into their tissue and will exclude 13C (d13C = ~-25‰). • Within the ocean: • 6CO2 + 6H2O + light <--> C6H12O6 + 6O2 • Surface water is enriched in 13C (d13C = 1-2‰) • Deep water becomes enriched in 12C (d13C=0‰)
Two Modes of Circulation • Warm Mode • N. Atlantic Deep Water • Shallow Compensation • Cold Mode • N. Atlantic Intermediate and Upper Deep Water • Deep Compensation
Mg/Ca Paleothermometry • Based on the principle that Mg is substituted for Ca in the lattice of foraminifera and that this substitution to a first order reflects temperature. • Bottom line is higher Mg/Ca ratios correlate with higher calcification temperatures
Alkenone Paleothermometry • Uk37 is a measure of the ratio of certain saturated vs unsaturated Ketones in the organic matter of coccolithiphorids • Prahl (1988) demonstrated that this ratio varies linearly with temperature