Comprehensive Guide to Using QueryLink for Campus Data Retrieval
This tutorial serves as an in-depth resource for utilizing QueryLink to access campus data for departmental needs. Designed by ACT’s Data Warehouse team, it provides a step-by-step overview of the point-and-click environment allowing users to navigate through the Query Model, customize queries, and utilize drop-down menus effectively. Key functionalities such as selecting field names, entering values to qualify data, and managing saved queries are also covered. The tutorial empowers users to efficiently extract and manipulate vital data pertaining to UCSD's operations.

Comprehensive Guide to Using QueryLink for Campus Data Retrieval
E N D
Presentation Transcript
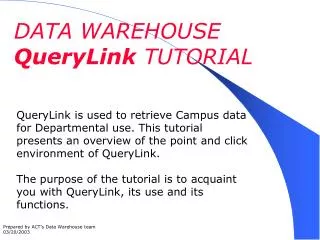
DATA WAREHOUSE QueryLink TUTORIAL QueryLink is used to retrieve Campus data for Departmental use. This tutorial presents an overview of the point and click environment of QueryLink. The purpose of the tutorial is to acquaint you with QueryLink, its use and its functions. Prepared by ACT’s Data Warehouse team 03/20/2003
TABLE OF CONTENTS • Where to Start? • Navigating Within the Query Model • Customizing the Query • Using Tabs • Selecting Field Names • Using Drop Down Menus • Entering Values to Qualify Data • Query Options • Row Count • Saving your Query • And More…. • Submitting your Query
WHERE TO START ? This section of the Tutorial presents steps you can follow to access the Data Warehouse QueryLink.
This is DataLink’s Web page. You can access DataLink from UCSD’s Blink website. Click on the Technology tab. Go to the LinkFamily.
All models available to the Campus will be accessible from DataLink. Models can be related to any UCSD business data such as Financial, Student, Employee. New models are developed depending on campus needs and requests for data.
Queries buttons are also located on other ‘Link Family’ web applications where you can access ‘subject related’ Query Models.
In this case, you can access query models to retrieve Employee data.
To display ‘help information’ for a specific Query Model, click on its associated i button.
This is the ‘help information’ for the Index Query. The Product Features section explains the ‘general functionality’ applicable to all Query Models.
Click on a Model to select it. We are selecting the Index Query Model.
The login screen will appear next. Enter your User Id and Password.
This is the Index Query Model. Once your login is successful, the Query Model displayed will be the query you selected.
NAVIGATING WITHIN THE QUERY MODEL CUSTOMIZING THE QUERY This section explains how to Navigate within a Query Model and how to customize your Query.
A Query Model is made up of ‘parts’ such as screens, tabs, field names,drop down menus, text entry boxes, selection check boxes and buttons.
All Query Models have at least one screen. Each screen has an associated Tab.
Dates is the Tab for this screen. The data elements on this screen are related to Dates data.
Index is the Tab for this screen. These data elements are related to INDEX data.
Any data element that is selected with a check mark in the selection box will be returned in the results set of the query.
Sometimes a screen will appear with a pre-selected data element. Data will automatically be displayed in the results set for this data element.
If you submit your query and have not entered or selected a value for a required field, a message will display and the Query will not execute.
Clicking on a data element will display the definition of that data element.
This page is displaying the definition of Index. You can access ‘DataLink’ for additional information.
USING DROP DOWN MENUS This section describes the different Drop Down Menus and how to use them.
A Drop Down Menu is indicated by a downward pointing arrow. In this case you can select a ‘value’ from the drop down list and use it to customize your query.
In this case, you can select a qualifyingparameter that you can use to customize your query.
In some cases, you can choose one or more selections from a list.
ENTERING VALUES TO QUALIFY DATA This section describes ways to customize your query by entering ‘values’ for data elements.
If a data element’s text entry box displays as empty,without any downward pointing arrows or scroll bars, you can enter a value for that data element. This is a value for the ‘Organization’ field.
Selecting the in list parameter allows you to enter more than one ‘value’ for the field.
Use the List Wizard to enter the values you desire. Click OK.
The parameter displays as ‘in list’ and the values display in the text entry box.
With the Advanced Wizard you can enter combinations of qualifying parameters with specific values. Click OK to activate.
The parameter displays as ‘advanced’ and the values’ display in the text box.
QUERY OPTIONS This section describes additional Query Options that are available for you to select.
Query Options that supply a variety of additional functionality are available from this drop down list.
The View Query Wizard allows you to review what fields were selected to be returned and what fields were used to qualify your query.
With the Save Wizard you have the ability to name and save your query for future use. Check this box if you would like your query to be available to other campus clients.
The Saved Query Manager allows you to load, rename or delete queries you have saved.
The Order Column Wizard allows you to customize the order the data will be displayed in the results set.
To customize the Order of the data in the results set, use the add button to move the field names to the box on the right. Place them in the order you desire.
The Sort Order Wizard allows you to sort the fields that are displayed in the results set. Use the add button to move the field names you would like for the sort to the box on the right.
The Subtotal Wizard allows you to subtotal the returned data. Use the add button to move the field names you wish to subtotal to the box on the right.
This data is totaled on the primary field in this case Sub-Account followed by fund and index.
Selecting the Turn SQL Displayer On (Off) provides you the option of viewing the actual SQL that the Query Model constructs to execute your Query. The default value for this option is ‘OFF’
The default value for ‘Results Rows’ is 2000. Currently there is a maximum row count of 50,000. The Results Row Count Wizard allows you to regulate the amount of rows returned from your query.