Missing Data
Missing Data. What do we mean by missing data?. Missing observations which were intended to be collected but: Never collected Lost accidently Wrongly collected so deleted Outcomes and/or Explanatory variables. Effect of Missing Data. Can cause


Missing Data
E N D
Presentation Transcript
What do we mean by missing data? • Missing observations which were intended to be collected but: • Never collected • Lost accidently • Wrongly collected so deleted • Outcomes and/or Explanatory variables
Effect of Missing Data • Can cause • Biased estimates, means, regression parameters • Biased standard errors, resulting in incorrect P-values and CI
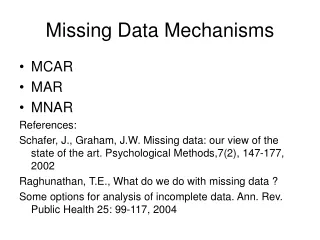
Missing data mechanism 1. Missing Completely At Random : MCAR • Missing does not depend on observed or unobserved values • Eg. Missing FBC because a tube with blood material is accidently broken • BP missing due broken machine
Missing data mechanism 2. Missing At Random : MAR • Missing depends on observed data, but not on the unobserved data. • Eg. 18-25 year olds are less likely to respond to a follow up postal questionnaire – more likely to change address several times
Missing data mechanism 3. Missing Not At Random: MNAR • Given all available observed information, the probability of being missing still depends on the unobserved data • Eg. Patient misses an appointment because they feel ill. This illness (e.g.flu) is related to the measurement intended to be made (e.g temperature)
The Assumptions • Cannot tell from data at hand whether the missing values are MCAR, MNAR or MAR • Can distinguish between MCAR and MAR • MAR can be made more likely by looking at associations between missing values and non missing observations in explanatory variables
Problem: Makes results too certain Simple methods to handle missing data • Complete Case (CC) analysis • Mean Imputation • Regression imputation • Stochastic Imputation
Multiple Imputation (MI) • Under MAR assumption, gives less biased estimates and SEs, when compared to CC • Covers many different data structures • Never absolute best thing to do
ID x1 x2 1 32.4 204 2 5.6 5.8 3 26.7 308 4 13.3 15.9 5 10.4 12.2 6 10.1 6.0 Multiple Imputation (MI) 14.2 ? 6.8 ?
Key Idea behind Imputation • Express our uncertainty about missing data by creating ‘m’ imputed data sets • Analyse each of these in usual way • Combine estimates using particular rules (Rubin’s rules)
Key Idea behind Imputation • Two variables: X1 and X2 • X1 missing in some records • X2 not missing, observed in every unit • Learn relationship between X1 and X2 • Complete data set by drawing the missing observations from X1 | X2
Example 1 • Longitudinal Breast Cancer study • Outcome: Early death or disease recurrence • Explanatory variables: age, meno, tam • Cox regression
How much is missing? variables with no mv's: id meno rectime censrec _st _d _t _t0 lnt Variable | type obs mv variable label -------------+------------------------------------------------ age | float 554 132 age, years tam | byte 557 129 hormonal therapy -------------------------------------------------------------- N: 686
CC Analysis Cox regression -- Breslow method for ties No. of subjects = 452 Number of obs = 452 No. of failures = 193 Time at risk = 1412.848734 LR chi2(3) = 5.15 Log likelihood = -1073.9288 Prob > chi2 = 0.1613 ------------------------------------------------------------------------------ _t | Haz. Ratio Std. Err. z P>|z| [95% Conf. Interval] -------------+---------------------------------------------------------------- age | .993877 .0108284 -0.56 0.573 .9728787 1.015328 tam | .723719 .1162513 -2.01 0.044 .528252 .991514 meno | 1.312512 .2877824 1.24 0.215 .85402 2.017151 ------------------------------------------------------------------------------
MI in Practice • STATA : ICE • Multiple Imputation by Chained Equations (MICE) • Univariate imputation - uvis • Multivariate imputation - ice
0 .06 .04 .02 0 1 Density .06 .04 .02 0 20 40 60 80 Age (years) Graphs by agemiss
MI Analysis mim: stcox age tam meno Multiple-imputation estimates (stcox) Imputations = 5 Minimum obs = 686 Minimum dof = 69.9 ------------------------------------------------------------------------------ _t | Haz. Rat. Std. Err. t P>|t| [95% Conf. Int.] FMI -------------+---------------------------------------------------------------- age | .985514 .010088 -1.43 0.158 .965598 1.00584 0.247 tam | .724898 .101434 -2.30 0.023 .54933 .956578 0.191 meno | 1.42128 .276051 1.81 0.072 .968226 2.08633 0.160 ------------------------------------------------------------------------------
Summary • Most studies will have missing data • MI suitable. Gives less biased estimates, SE, under MAR and MCAR • MI is a useful tool for dealing with missing data.