Missing Data Mechanisms in Statistical Analysis
Explore MCAR, MAR, and MNAR missing data mechanisms, graphical representation, and methods for analyzing data with missing values. Learn about survey data analysis methods and software for ML estimation. Discover Multiple Imputation and its efficiency, along with comments on MI methods and transforming skewed data. Dive into selection models and pattern mixture models in longitudinal studies.

Missing Data Mechanisms in Statistical Analysis
E N D
Presentation Transcript
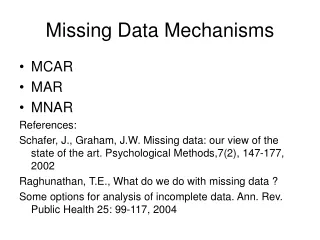
Missing Data Mechanisms • MCAR • MAR • MNAR References: Schafer, J., Graham, J.W. Missing data: our view of the state of the art. Psychological Methods,7(2), 147-177, 2002 Raghunathan, T.E., What do we do with missing data ? Some options for analysis of incomplete data. Ann. Rev. Public Health 25: 99-117, 2004
Graphical representation Y = variable partly missing X = variable completely observed Z = cause of missingness (unrelated to Y) R = represents missingness
X Z X Z X Z R Y Y R Y R MCAR MAR MNAR
Use of conditional probability Yc = the complete vector of Y observations Yc = ( Yo , Ym) MCAR: P (R | Yc) = P(R) Prob of missing does not depend on Yo MAR: P (R | Yc) = P( R | Yo) Prob of missing depends only on Yo MNAR: P (R | Yc) = P( R | Ym) Prob of missing depends on unobserved Ym
Methods for analyzing data with missing values in the repeated measures situation Case deletion: delete subjects with missing components (complete case analysis) Available case analysis: analysis is based on all observable data (use data from subjects with complete Y vectors as well as incomplete Y vectors)
Simulation Study: Parameter: MCAR MAR MNAR --------------------------------------------------------- Μean(Y):125 125 (7.0) 143.3(19.3) 155.5(30.7) Std(Y): 25 24.6(5.3) 20.9(5.8) 12.2(13.2) Rho: 0.6 0.59(0.2) 0.33(0.37) 0.34(0.36) Beta Y|X: 0.6 0.61(0.27) 0.60 (0.51) 0.21(0.43) Beta X|Y: 0.6 0.60(0.25) 0.20(0.44) 0.60(0.52) --------------------------------------------------------------------------- Generate: 50 observations from bivariate normal (Y,X) MCAR: prob Y missing is 0.73 (high !) MAR: prob Y missing if X < 141 MNAR: prob Y missing if Y < 141
Methods for analyzing survey data Weight responses that are present Average the available items (social sciences based on standardized scores but not studied in any systematic fashion)
Single imputation MS: Mean substitution HD: Hot Deck CM : conditional mean PD: predictive distribution
ML estimation Widely accepted Yields unbiased estimators under general regular conditions Provides a mechanism to do inference: testing hypotheses and confidence intervals Often relies on the EM algorithm Newton-Raphson /Fisher scoring used in multilevel modeling
Software for ML estimation SPSS: missing data module EMCOV NORM SAS: Proc Mixed S-Plus: lme function STATA LISREL Mplus HLM / MLWin (multi-level models)
Simulation Study: ML estimation Parameter: MCAR MAR MNAR --------------------------------------------------------- Μean(Y):125 124.8(6.5) 125.2(16.9) 151.6(26.9) Std(Y): 25 24.2(5.7) 25.5(7.4) 12.3(13.2) Rho: 0.6 0.61(0.2) 0.52(0.38) 0.39(0.36) Beta Y|X: 0.6 0.61(0.27) 0.60 (0.51) 0.21(0.43) Beta X|Y: 0.6 0.63(0.25) 0.49(0.38) 0.79(0.68) --------------------------------------------------------------------------- Generate: 50 observations from bivariate normal (Y,X) MCAR: prob Y missing is 0.73 (high !) MAR: prob Y missing if X < 141 MNAR: prob Y missing if Y < 141
ML estimation More attractive than ad-hoc methods Assume a large sample May or may not be robust to model assumptions Assume MAR
Multiple Imputation Each missing value replaced by m > 1 values: effectively create m datasets Efficiency: (1 + λ / m)-1 where λ is the rate of missing information implies m need not be large but certainly larger than 1 Rubin’s rules for combining estimators are now well accepted Helps to be a Bayesian ! MAR is usually assumed
Software NORM Proc MI in SAS: regression, propensity scores, MCMC This does NORM plus other routines SAS macro: IVE library S-Plus: missing data library (NORM) longitudinal data uses function PAN LISREL: missing data library like NORM SOLAS (same as Proc MI ??) http://www.multiple-imputation.com
Comments on MI methods Regression based MI methods are really based on Ml estimation: usually require a multivariate normal distribution Should you transform skewed data to normality (log or power transformation)? Partial answer: no Graham and Schafer (1999) Practice of rounding data to create binary/ordinal variables ? Partial answer: okay even for small samples
Comments continued: However: better specialized methods are available Schaffer (1997) for nominal data Liu et al (2000) for clustered data How about propensity scores ? No: can distort covariance structure in data (Allison, 2000)
Simulation Study: MI (NORM) Parameter: MCAR MAR MNAR --------------------------------------------------------- Μean(Y):125 124.9(6.5) 125.3(17.2) 151.6(26.9) Std(Y): 25 25.9(5.9) 28.7(8.2) 13.6(12.1) Rho: 0.6 0.57(0.2) 0.45(0.37) 0.35(0.36) Beta Y|X: 0.6 0.61(0.27) 0.59 (0.52) 0.21(0.43) Beta X|Y: 0.6 0.56(0.22) 0.39(0.38) 0.66(0.56) --------------------------------------------------------------------------- Generate: 50 observations from bivariate normal (Y,X) MCAR: prob Y missing is 0.73 (high !) MAR: prob Y missing if X < 141 MNAR: prob Y missing if Y < 141
Methods that do not assume MAR Selection models Pattern Mixture models
Food for thought In an longitudinal study on aging many subjects die while on study Is MAR a reasonable assumption ? Alternatively: joint modeling of outcome and death may be superior