Download
1 / 56
560 likes | 717 Vues
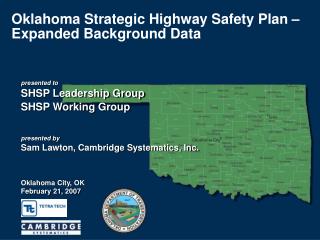
Oklahoma Strategic Highway Safety Plan – Expanded Background Data. presented to SHSP Leadership Group SHSP Working Group presented by Sam Lawton, Cambridge Systematics, Inc. Oklahoma City, OK February 21, 2007. Drivers Young Unlicensed/suspended/ revoked drivers Older Aggressive

E N D
Oklahoma Strategic Highway Safety Plan –Expanded Background Data presented toSHSP Leadership Group SHSP Working Group presented bySam Lawton, Cambridge Systematics, Inc. Oklahoma City, OK February 21, 2007
Drivers Young Unlicensed/suspended/ revoked drivers Older Aggressive Impaired Distracted/fatigued Seat belt use Speed Special users Pedestrians Bicyclists Vehicles Motorcycles Heavy trucks AASHTO SHSP Emphasis Areas
Highways Trees Run off the road Horizontal curves Utility poles Unsignalized intersections Head-on collisions Head-on crashes on freeways Work zones EMS Rural emergency medical services Management Data Integrated safety management process AASHTO SHSP Emphasis Areas (continued)
Oklahoma Fatalities Number of Fatalities 900 838 850 802 800 774 750 772 741 739 755 700 682 671 650 650 600 550 500 450 400 1996 1997 1998 1999 2000 2001 2002 2003 2004 2005 Source: FARS
Incapacitating Injuries Number of Incapacitating Injuries (In Thousands) 6 5.1 4.9 5 4.5 4.4 4.0 3.9 3.8 3.7 3.6 4 3.4 3 2 1 0 1996 1997 1998 1999 2000 2001 2002 2003 2004 2005 Source: OHSO
Fatal and Incapacitating Injury Crash Trends Number of Incapacitating Injury Crashes(In Thousands) Number of Fatal Crashes 4.0 800 3.8 3.7 709 3.4 3.3 666 700 3.5 735 639 3.1 678 595 590 661 600 3.0 627 3.0 586 2.9 2.8 2.5 500 2.7 2.7 400 2.0 300 1.5 200 1.0 100 0.5 0.0 0 1996 1997 1998 1999 2000 2001 2002 2003 2004 2005 Source: OHSO Incapacitating Injury Collisions Fatal Collisions
Fatality and Injury Rate per 100 Million VMT Rate 80 71.0 70.2 53.3 60 49.2 42.2 54.9 49.1 40 45.3 43.2 39.9 20 0 1996 1997 1998 1999 2000 2001 2002 2003 2004 2005 Year Source: OHSO Fatality and Injury Rate Trend Line
Fatality Rate Compared to U.S. Average Fatality Rate per 100 Million VMT 2.5 2.02 1.93 1.96 2.0 1.80 1.74 1.74 1.71 1.67 1.62 1.57 1.50 1.47 1.73 1.73 1.69 1.5 1.64 1.58 1.55 1.51 1.53 1.51 1.48 1.45 1.44 1.0 0.5 Oklahoma Fatality Rate per 100 Million VMT U.S. Fatality Rate per 100 Million VMT 0.0 1994 1995 1996 1997 1998 1999 2000 2001 2002 2003 2004 2005 Source: FARS
2005 Fatal Crashes Drivers Under 16 to 24 Percent 40 35.5% 35 30 25 20 15.6% 14.7% 13.4% 15 7.2% 6.8% 10 5.1% 2.9% 5 0.7% 0.4% 0 Drivers Under 16 Drivers Age 16-17 Drivers Age 18-20 Drivers Age 21-24 Total Under 16-24 Percent of Fatal Crashes Percent Drivers Licenses
2005 Fatal Crashes Drivers 65 and Older Percent 17.1% 17.0% 18 16 14 12 10 8 5.3% 4.9% 4.7% 4.4% 6 4.3% 3.9% 3.5% 3.1% 4 2 0 Drivers Age 65-70 Drivers Age 71-75 Drivers Age 76-80 Drivers Age 81+ Total 65-85+ Percent of Fatal Crashes Percent Drivers Licenses
Younger and Older Drivers in Fatal Crashes Percent 50 43.9% 42.8% 45 41.9% 39.0% 38.1% 40 41.3% 41.1% 35 38.3% 37.6% 35.5% 30 25 20.1% 18.2% 18.2% 18.0% 17.1% 20 19.7% 19.1% 15 18.0% 17.4% 16.1% 10 5 0 1996 1998 1999 2001 2002 2003 2004 2005 1997 2000 Percent Under 16 to 24 Percent Under 65 to 85+
Alcohol/Drug-Related Fatalities Fatalities 250 229 187 200 179 200 172 150 166 165 159 150 147 100 50 0 1996 1997 1998 1999 2000 2001 2002 2003 2004 2005 Year Source: OHSO Fatalities Trend Line
Alcohol/Drug-Related FatalitiesPercent of Total Fatalities Rate (Percent) 30 26.2% 25.2% 23.6% 22.7% 20 22.4% 22.3% 21.5% 20.9% 20.8% 19.4% 10 0 1996 1997 1998 1999 2000 2001 2002 2003 2004 2005 Year Source: OHSO Proportion Trend Line
Alcohol Related Fatalities as Percent of Total FatalitiesOklahoma Compared to U.S. Average Percent of Fatalities 45 41% 41% 40% 40% 39% 39% 39% 40 36% 35% 34% 35 30 25 20 15 10 5 0 2001 2002 2003 2004 2005 Source: NHTSA/NCSA 2005. OK U.S.
Alcohol Related Fatality Rate per 100 Million VMT Rate per 100 Million VMT 0.64 0.62 0.62 0.61 0.61 0.60 0.60 0.59 0.58 0.57 0.57 0.56 0.56 0.55 0.54 0.52 0.50 2001 2002 2003 2004 2005 OK U.S. Average Source: FARS
Fatal Crashes with Fatigued/Distracted Drivers Number of Fatal Crashes 80 67 70 64 64 62 59 57 60 50 55 50 48 40 37 30 20 Fatal Crashes 10 Linear (Fatal Crashes) 0 1996 1997 1998 1999 2000 2001 2002 2003 2004 2005 Year Source: OHSO
Incapacitating Crashes with Fatigued/Distracted Drivers Number of Incapacitating Crashes 450 411 406 375 400 350 350 401 350 360 348 348 345 300 250 200 150 100 Incapacitating Crashes 50 Linear (Incapacitating Crashes) 0 1996 1997 1998 1999 2000 2001 2002 2003 2004 2005 Year Source: OHSO
Fatigued/Distracted Driver Fatal and Injury Crashes as a Percent of Total Injury Crashes Percent of Total Injury Crashes 8 6.58% 7 6.37% 6.02% 6.67% 5.53% 6 5.45% 6.18% 5 5.58% 5.24% 5.14% 4 3 2 Percent of Total Injury Crashes 1 Linear (Percent of Total Injury Crashes) 0 1996 1997 1998 1999 2000 2001 2002 2003 2004 2005 Year Source: OHSO
Driver Error Fatalities Fatalities 400 353 333 328 282 300 325 318 263 280 271 261 200 100 0 1996 1997 1998 1999 2000 2001 2002 2003 2004 2005 Source: OHSO Year Fatalities Trend Line
Driver Error FatalitiesPercent of Total Fatalities Fatalities (in Percent) 50 44.6% 44.4% 41.7% 41.7% 39.7% 40 41.8% 41.4% 39.4% 36.3% 30 32.9% 20 10 0 1996 1997 1998 1999 2000 2001 2002 2003 2004 2005 Source: OHSO Year Percent of Total OK Fatalities Trend Line
Safety Belt Use Rate Compared to U.S. Average Safety Belt Use Rate (in Percent) 83.7% 83.1% 90 82% 80.3% 81% 80% 79% 76.7% 75% 80 70.1% 71% 71% 67.9% 67.5% 69% 69% 67% 70 60.7% 56.0% 60 47.4% 50 40 30 20 10 0 1997 1998 1999 2000 2001 2002 2003 2004 2005 2006 Source: NHTSA, OHSO OK Belt Use Rate U.S. Average Belt Use Rate
Child Restraint Compliance Percent 100 86.7% 80.6% 77.4% 76.8% 80 82.7% 75.7% 60 66.0% 62.5% 54.4% 53.0% 51.8% 40 20 0 1996 1997 1998 1999 2000 2001 2002 2003 2004 2005 2006 Year Source: OHSO Rate Trend Line
Unsafe Speed Fatalities Fatalities 300 239 239 238 250 228 220 200 205 186 179 181 177 150 100 50 0 1996 1997 1998 1999 2000 2001 2002 2003 2004 2005 Year Source: OHSO Fatalities Trend Line
Unsafe Speed FatalitiesPercent of Total Fatalities Fatalities (in Percent) 35 30.8% 30.6% 30.1% 29.9% 28.6% 28.1% 30 25 26.9% 26.3% 24.5% 24.0% 20 15 10 5 0 1996 1997 1998 1999 2000 2001 2002 2003 2004 2005 Year Source: OHSO Percent of Total OK Fatalities Trend Line
Speeding Related Fatalities as Percent of Total FatalitiesOklahoma Compared to U.S. Average Fatalities (in Percent) 45 42% 42% 41% 41% 40 36% 35 32% 31% 31% 31% 30% 30 25 20 15 10 5 0 2001 2002 2003 2004 2005 Source: NHTSA/NCSA, Traffic Safety Facts, Oklahoma 2005. OK U.S.
Oklahoma Pedestrian Fatalities Pedestrian Fatalities 80 69 70 60 61 60 54 50 50 50 49 46 40 43 37 30 20 10 Source: FARS Pedestrian Linear (Pedestrian) 0 1996 1997 1998 1999 2000 2001 2002 2003 2004 2005
Pedestrian FatalitiesPercent of Total Fatalities Percent of Total Fatalities 13.0% 14 12.7% 12.6% 11.8% 11.6% 11.4% 11.3% 11.2% 11.1% 10.9% 12 10 8.2% 8.1% 7.9% 7.3% 7.2% 8 6.6% 6.5% 6.2% 6.1% 5.5% 6 4 2 0 1996 1997 1998 1999 2000 2001 2002 2003 2004 2005 Source: FARS Oklahoma Pedestrian Fatalities as Percent of Total Fatalities U.S. Pedestrian Fatalities as Percent of Total Fatalities
Bicycle Fatalities Fatalities 10 9 8 7 6 6 6 5 5 5 4 4 3 2 2 0 1996 1997 1998 1999 2000 2001 2002 2003 2004 2005 Year Source: OHSO Fatalities Trend Line
Vehicles Involved in Fatal CrashesOklahoma Compared to U.S. Average, 2005 Percent of Fatal Crashes 50 45.3% 42.2% 45 38.5% 40 35.1% 35 30 25 20 15 10.4% 8.3% 7.8% 7.8% 10 4.7% 2.8% 2.8% 5 1.2% 0 Passenger Cars Light Trucks Large Trucks Motorcycles Buses Other/Unknown Source: FARS OK U.S.
Oklahoma Motorcycle Fatalities Motorcycle Fatalities 90 78 77 80 73 70 60 50 39 40 33 33 39 30 25 25 20 24 10 Motorcycle Linear (Motorcycle) 0 1996 1997 1998 1999 2000 2001 2002 2003 2004 2005 Source: FARS
Motorcycle Fatalities as Percent of Total FatalitiesOklahoma Compared to U.S. Percent of Fatalities 12 10.9% 10.5% 10.1% 10 9.6% 9.4% 8.7% 7.6% 8 7.6% 6.9% 6.0% 5.7% 6 5.5% 5.1% 5.0% 5.3% 4.5% 3.9% 4 3.7% 3.3% 3.2% 2 Motorcycle Fatalities as Percent of all Fatalities Motorcycle Fatalities as Percent Involvement in U.S. Fatal Crashes 0 1996 1997 1998 1999 2000 2001 2002 2003 2004 2005 Source: FARS
Fatal Truck Crashes Number of Fatal Crashes 100 89 85 84 90 83 81 79 80 69 70 63 62 59 60 50 43 40 29 26 30 25 22 16 20 15 11 10 10 6 0 1996 1997 1998 1999 2000 2001 2002 2003 2004 2005 Year Source: OHSO Single Unit Trucks Truck Tractors/Semi Trailers
Injury Truck Crashes Number of Injury Crashes 1,487 1,600 1,400 1,262 1,200 1,000 783 800 671 618 613 602 583 570 563 563 537 600 475 481 401 391 354 349 328 400 268 200 0 1996 1997 1998 1999 2000 2001 2002 2003 2004 2005 Source: OHSO Year Single Unit Trucks Truck Tractors/Semi Trailers
Fatal Truck Crashes as a Percent ofTotal Fatal Crashes Percent of Total Fatal Crashes 18.4% 20 17.0% 16.7% 18 16.2% 16.0% 15.0% 14.7% 16 14.3% 13.4% 14 12 10 8 5.6% 6 4 2 0 1996 1997 1998 1999 2000 2001 2002 2003 2004 2005 Year Source: OHSO Single Unit Plus TruckTractors/Semi Trailers
2005 Urban/Rural Fatal Crashes Urban 30.9% Rural 69.1% Source: ODOT Traffic Engineering Division
Fatal Crashes by Road Function Class2000-2005 Principal Arterial Source: FARS
2005 Fatal Crashes on Urban Roadways Principal Arterial – Interstate 37 Local 52 Principal Arterial –Other Freeways and Expressways 17 Collector 8 Minor Arterial 37 Principal Arterial – Other 68 Source: ODOT Traffic Engineering Division
2005 Fatal Crashes on Rural Roadways Principal Arterial – Interstate 57 Minor Collector and Local 155 Principal Arterial – Other 87 Minor Arterial 81 Major Collector 110 Source: ODOT Traffic Engineering Division
Fatal Single Vehicle Crashes Number of Fatal Crashes 450 380 400 370 360 342 392 350 300 331 310 301 301 301 250 200 150 Fatal Crashes 100 Linear (Fatal Crashes) 50 0 1996 1997 1998 1999 2000 2001 2002 2003 2004 2005 Year Source: OHSO
Incapacitating Single Vehicle Crashes Number of Incapacitating Crashes 1,800 1,571 1,600 1,473 1,268 1,400 1,213 1,163 1,359 1,200 1,274 1,263 1,251 1,190 1,000 800 600 400 Incapacitating Crashes 200 Linear (Incapacitating Crashes) 0 1996 1997 1998 1999 2000 2001 2002 2003 2004 2005 Source: OHSO Year
Fatal and Injury Single Vehicle Crashes as a Percent of Total Injury Crashes Percent of Total Injury Crashes 19 18.57% 18 17.62% 17.19% 17.13% 17.89% 16.91% 17.54% 17.49% 17 16.67% 16.86% 16 15 Percent of Total Injury Crashes Linear (Percent of Total Injury Crashes) 14 1996 1997 1998 1999 2000 2001 2002 2003 2004 2005 Year Source: OHSO
Fatal Roadway Departure Crashes Number of Fatal Crashes 350 286 277 300 271 271 312 250 244 239 238 231 228 200 150 100 Fatal Crashes 50 Linear (Fatal Crashes) 0 1996 1997 1998 1999 2000 2001 2002 2003 2004 2005 Year Source: ODOT Traffic Engineering Division.
Incapacitating Roadway Departure Crashes Number of Incapacitating Crashes 1,400 1,204 1,200 983 964 1,117 1,000 880 870 1,052 985 967 910 800 600 400 Incapacitating Crashes 200 Linear (Incapacitating Crashes) 0 1996 1997 1998 1999 2000 2001 2002 2003 2004 2005 Source: ODOT Traffic Engineering Division. Year
Fatal and Injury Roadway Departure Crashes as a Percent of Total Injury Crashes Percent of Total Injury Crashes 14.63% 15 13.97% 13.58% 14 13.24% 13.18% 13.77% 13.79% 13.36% 13 13.01% 13.03% 12 11 Percent of Total Injury Crashes Linear (Percent of Total Injury Crashes) 10 1996 1997 1998 1999 2000 2001 2002 2003 2004 2005 Year Source: ODOT Traffic Engineering Division.
Roadway Departure Fatalities as Percent of Total FatalitiesOklahoma Compared to U.S. Average Percent of Fatalities 80 72% 67% 70 65% 63% 60% 60% 59% 58% 56% 60 55% 50 40 30 20 10 0 2001 2002 2003 2004 2005 Source: FARS OK U.S.