Download
1 / 114
1.14k likes | 1.26k Vues
Join the Highway Data Services Bureau of the New York State Department of Transportation for a comprehensive overview of functional class maps, traffic data analysis, and forecasting techniques presented in February 2010. Discover the latest enhancements in data access, including the new Functional Class Map Viewer, which integrates updated GIS files and reflects recent approved changes. Learn about data collection methodologies, project level forecasts, and insights into traffic patterns essential for planning and development.

E N D
Welcome back to the… Highway Data WorkshopFebruary, 2010 Highway Data Services Bureau New York State Department of Transportation 50 Wolf Road, 3-2 Albany, New York 12232 (518) 457-1965
THIS MORNING • Functional Class Map Viewer • Newest Data on the Web • Traffic Data Analysis/Forecasting • Project Level Forecasts • Traffic Assignment Modeling • Vehicle Miles of Travel
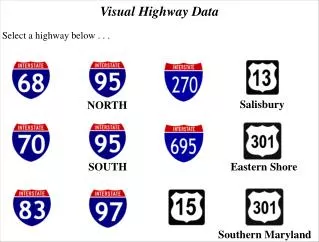
Functional Class Maps -A proposed approach for the next update • Old approach • Static pdf images • Difficult to produce • Do not reflect subsequent approved changes • Proposed approach • Functional Class Viewer • Based on an approved FC system • Approved changes applied immediately • Updated GIS files readily available
Functional Class Viewer • Internet-based viewer • Based on approved system as encoded in a GIS-based file • Link to original approval document • Revisions noted by link to approval memos • Revised GIS data regularly distributed http://wvmoap22/fc/
Data on the Web • Highway Data • Detailed Inventory Listings • Functional Class Maps • Highway Mileage Report • Traffic Data • Traffic Data Report • Hourly Traffic Volume Files • Reference and Factor Files
Highway Data Services Bureau • www.nysdot.gov • A to Z Site Index • Select “H” • Select “Highway Data Services Bureau”
Other NYSDOT Links • https://www.nysdot.gov/divisions/ policy-and-strategy/darb/dai-unit/ttss • FHWA/FTA approved Urban Areas • Census-based Urban Areas • Metropolitan Planning Areas • Statewide Annual VMT since 1920
Other NYSDOT Links • https://www.nysdot.gov/divisions/ policy-and-strategy/darb/dai-unit/ttss • Traffic Change in New York State • Change in Traffic on NYS Bridges, Thruway and Roads, January 2010 • Contains transit and other data as well as traffic data
Other NYSDOT Links • https://www.nysdot.gov/divisions/ operating/oom/transportation-systems/manuals • Qualifying and Access Highways (trucks) • Touring Route Book • https://www.nysdot.gov/divisions/ engineering/design/dqab/rmm • Reference Marker Manual
Other NYSDOT Links • https://www.nysdot.gov/main/bridgedata • Bridge information (BIN, condition, location) • http://gisweb2/strviewer/ • Viewer showing location of all bridges and culverts with condition ratings and postings • Only available internally (Intradot)
Potential RIS Viewer • Currently in development • Hope to eventually offer via the Internet • Links RIS data to GIS, orthoimagery, Photolog • Links from within RIS or directly through viewer interface
THIS MORNING • Functional Class Map Viewer • Newest Data on the Web • Traffic Data Analysis/Forecasting • Project Level Forecasts • Traffic Assignment Modeling • Vehicle Miles of Travel
HDSB Forecasting • Current year estimates • Matrix process • Traffic Data Forecaster • HPMS • Current year estimates • VMT estimates • All based on linear regression
Traffic Count DataWhat is collected • Volume • Vehicle Classification • Speed • Weigh-in-Motion
Traffic Count StationsWhere it is collected COMPREHENSIVE COVERAGE State Highways/State System National Highway System All Other Federal Aid Eligible Roads SEGMENT SPECIFIC Highway Performance Monitoring System NHS Intermodal Connectors Bridges, Railroad Crossings Sampling of non-Federal Aid highways County counting partnership, MPOs
Traffic Count CoverageWhen it is collected • State Highways/State System – 3 yrs • HPMS Samples – 3 yrs • National Highway System – 3 yrs • Including Intermodal Connectors • Federal Aid eligible roads – 6 yrs • Bridges, Railroad Crossings – 5 yrs • Sampling of non-Federal Aid roads – 6 yrs • Special needs – on demand
Traffic Count DataHow it is collected • Continuous versus short counts • Continuous • About 175 sites • Daily and other temporal patterns • Design hour volume factors • Short (coverage) counts • Large quantity at low cost • Stations covering about 30,000 miles
Some of the Data UsersWhy it is collected Internal Users of Traffic Data • Planners – MPOs, Policy & Planning Div. • AADT, hourly, quarter hour • CNAM, BNAM, PNAM, traffic assignment models • Designers – scope and scale • AADT, DHV/DDHV, % trucks, turn moves • Traffic Engineers – safety analyses • Maintenance/Construction - MPOT
Some of the Data UsersWhy it is collected External Users • Air quality planners/researchers • Transportation researchers - professors & students, public & non-profit agencies • Realtors/developers • Lawyers • Health researchers • New York State Police
Available Data • AADT – Inventories, TDR, TDV, Matrix • Hourly – Interval data on Internet • Class, Speed – reports on TDV, data files on request • Adjustment factors – axle, “seasonal” • DHV, DDHV, K factor/d factor • Vehicle Miles of Travel • HPMS estimates by FC by Urban Area
Vehicle ClassificationsBased on axle spacing via speed with which tubes are crossed • 1 Motorcycles • 2 Passenger Cars • 3 Two axle, four tire trucks • 4 Buses • 5 Two axle, six tire • 6-10 Single trailer, varying no. of axles • 11-13 Double trailer, varying axles
“Seasonal” adjustments - Monthly Variations • Use continuous counter data • Calculate 12 monthly averages of the daily traffic (MADT) • Average 12 MADTs to get an Annual Average of the Daily Traffic (AADT) • Ratio of each MADT to AADT gives monthly factor
“Seasonal” adjustments - Daily Variations • Calculate using only weekdays (Mon to Fri noon) • Calculate using only weekend traffic • Yields three sets of adjustment factors • Full week or seven day, weekday, weekend • Daily variations are “lost” in monthly calculations • Weekday factors most commonly used • Seven day factors show true “seasonality”
Factor Groups • Stations stratified into FG based on 1980’s analyses • Minimal seasonality (commuter dominated) • Some seasonality • Highly seasonal • Even winter resorts show summer peaks • Region 7 reassessment in late 1990’s • “Flattening” of curves • NY metro area is “average” (FG = 30)
Design Hour Volumesand Directional Design Hour Volumes • 30th highest hour • Used for scaling capital projects • Continuous counters used to calculate DHV and DDHV factors (K and d) • Good for system analyses but questionable for project level • Site specific three-day high-hour versus ADT may give better project results
Design Hour Volumesand Directional Design Hour Volumes • 30th highest hour is used as a result of NCHRP study • Example: count station 26 0120 in Utica • Highest Hour= 3991 • 30th Hour= 3780 • 100th Hour= 3640 • 200th Hour= 3523
Vehicle Miles of Travel HPMS Statewide Estimates