Download
1 / 33
330 likes | 488 Vues
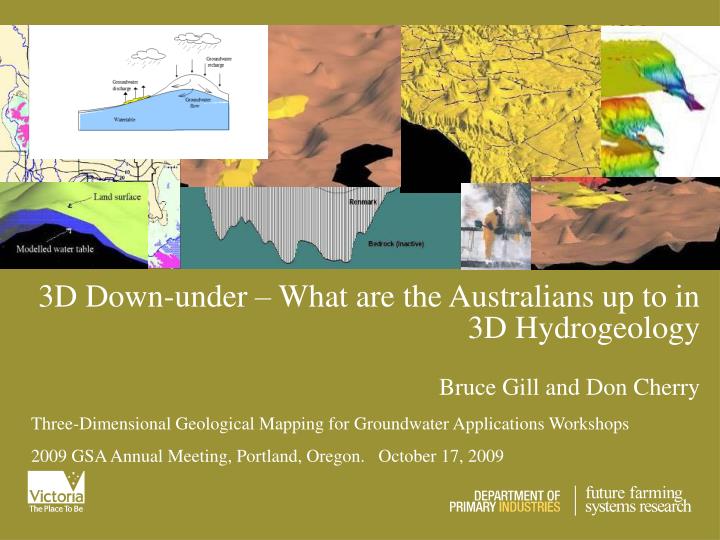
3D Down-under – What are the Australians up to in 3D Hydrogeology Bruce Gill and Don Cherry. Three-Dimensional Geological Mapping for Groundwater Applications Workshops 2009 GSA Annual Meeting, Portland, Oregon. October 17, 2009. Talk Outline. Current Groundwater situation in Australia

E N D
3D Down-under – What are the Australians up to in 3D HydrogeologyBruce Gill and Don Cherry Three-Dimensional Geological Mapping for Groundwater Applications Workshops 2009 GSA Annual Meeting, Portland, Oregon. October 17, 2009
Talk Outline • Current Groundwater situation in Australia • Victorian Study area descriptions • Victorian study objectives and method • Some findings to date • Completing this study • Other Australian Studies
Current Groundwater situation in Australia - Rainfall Continental average=455mm/yr
Current Groundwater situation in Australia – Major river basins
Current Groundwater situation in Australia – Groundwater Management • Water is the responsibility of the state and territory governments. • Realized in the late 1970s that licensed volumes in the Murray Darling Basin exceeded available supply • Nationally, about 50% of total groundwater abstraction is for irrigated agriculture, but 65% in Victoria and NSW and is highest in SA at 80%
Current Groundwater situation in Australia – Groundwater Management (cont’d) • Groundwater exploitation has risen in tandem with competition for surface water resources. • In NSW and Victoria, groundwater use has tripled between 1983/84 and 1996/97 • Recent dry decade has really focussed national attention on all water resources • Groundwater management seeking improved methods and reliability to underpin allocation decisions, management and water trading • 3D hydrogeology methods should help
Victorian Study Objectives • State and Federally funded 3 year study to explore the potential of 3D technologies in groundwater studies • Research how to apply the types of 3D visualisation tools routinely used in mining and oil industry to groundwater resource needs • Investigate the capability of GIS based 3D aquifer mapping to enhance landscape analysis and groundwater interactions
Study area background Campaspe Deep Lead WSPA Southern Campaspe Plains GMA • Campaspe 733km2 • North flowing, part of the Murray system • Significant surface and groundwater usage for towns, agriculture and rural communities • Moderate data level • Simple geology – narrow valley setting with Ordovician aged metasedimentary bedrock, thick sequence of Paleocene to Recent terrestrial sediments, minor Quaternary aged basalt, interbedded clay aquitards
Study area background (cont.) Groundwater declines in the Campaspe Management Area Permissible Consumptive Volume: 47,252ML Licensed allocation: 46,267 ML Metered usage (2007) 34,762ML, (50% of license in 2008 due to WL decline)
Mid Loddon WSPA Upper Loddon WSPA Spring Hill WSPA Study area background(cont.) • Loddon 2174km2 • North flowing, part of the Murray system • Significant surface and groundwater usage for towns, agriculture and rural communities • High data level • Complex geology – Ordovician metasedimentary and Devonian –aged granite bedrock, thick sequence of Paleocene to Recent terrestrial sediments, thick Quaternary aged basalt, interbedded clay aquitards
Study area background (cont.) Groundwater declines in the Upper Loddon (Spring Hill) Management Area Permissible Consumptive Volume: 55,910ML Licensed allocation: 55,508 ML Metered usage (2007) 29,251ML, (50% in some parts in 2008 due to declines)
Study area background (cont.) • Moorabool 3208km2 • South flowing to the ocean • Availability and quality of data is considered low • Complex geology - Ordovician metasedimentary and Devonian –aged granite bedrock, thick sequence of Paleocene to Recent marine & terrestrial sediments, blanketing Quaternary aged basalt, interbedded clay aquitards Bungaree WSPA
Methodology • Multiple databases (MS, web-based, custom etc) • Multiple formats (relational, spreadsheets etc) • Missing information (logs, coordinates) • Incorrect information (translation errors etc) • Poor or varying interpretation
Image showing impact of unreliable bore hole data on 3D surface construction Some outputs to date
Right – early 3D object of basalt in Campaspe study area Some outputs to date Left - voxel constructed block of part of the Moorabool study area
Several images of the Campaspe area - alluvial aquifer (brown) and basalt flow (orange) in bedrock valley. Some outputs to date
Some outputs to date Upper Loddon voxels of Basalt aquifer (brown) and Deep Lead Aquifer (green) with cross cutting faults (blue)
Completing our study • Adding groundwater chemistry • Exploring volumetric methods from mining / oil industry applied to quantify aquifers • Hydrogeology theory applied to 3D aquifers? (specific yields, groundwater management issues) • Outputting 3D model objects to numerical models (eg MODFLOW) • Field testing 3D visualisation to groundwater users and managers
Groundwater chemistry (salinity) Salinity variation in part of the Upper Loddon Deep Lead aquifer
Figure 1: Example visualisation in 2.5D using DEM with draped geology and a 3D block with drillholes Other Australian Studies • Queensland University of Technology ( Malcolm Cox et al) • Groundwater Visualisation System (GVS): A software framework for developing low-end, scalable and robust software for 3D visualisation and animation of groundwater conceptual models • GVS Used in several site studies
Other Australian Studies • University of New South Wales (Bryce Kelly, Beatrice Giambiastiani et al) • 3D Hydrograph Analysis for Constraining the Construction of Hydrogeological Models • 3D temporal analysis of surface and groundwater interactions • The need for better 3D conceptual models of aquifers
Other Australian Studies • GeoScience Australia (Alison Kirkby et al. and Pauline English et al.) • Eromanga Basin 3D (below) and Toowoomba, Qld Figure 3. A perspective view of the 3D map of the Eromanga Basin, a) showing all units, and b) view from the top of the Cadna-Owie Formation.
Other Australian Studies • Department of Water - Western Australia (David Schafer et al) • Aquifer mapping, regional models and stratigraphic analysis • Perth Basin on PETREL (right) • Leederville formation ( below)
Other Australian Studies • Southern Rural Water Authority, Victoria & Sinclair Knight Merz (Terry Flynn and Andrew Harrison) • 3D hydrogeology mapping for groundwater resource management – southern half of Victoria • First Australian 3D Hydrogeology Workshop held 31 Aug-1 Sept had 22 presentations • Extended abstracts and presentations available at :www.ga.gov.au/??????
Conclusions • Early success in identifying errors, aquifer geometries and alignment of geological interpretations. • 3D geological modelling is essential in the process of understanding the geological and hydrogeological features of an aquifer. • Significantly improves the capacity of models to interpret aquifer dimensions and connectivity. • Feed into groundwater management numerical models. • For public engagement