Download
1 / 14
140 likes | 152 Vues
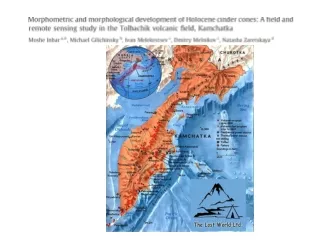
This study examines the morphology and erosion patterns of new and old volcanic cones in Kamchatka, highlighting changes over time. Topographic map and DEM models show differences in slopes and erosion rates, influenced by climate and vegetation. The research suggests that younger cones have higher h/w ratios and steeper slopes compared to older ones, with erosion peaks following eruptions and forest fires. The findings enhance understanding of volcanic landscape evolution in the region.

E N D
New Cones: N1, N2, N3, and Yuzhniy Erupted 1975-1976 Average slope:31.9 (ASTER), 31.7 (Map) Old cones: Kamenistaya, Krasniy, Camp, Stariy, and Alaid Erupted 1500-1700 years ago Average Slope:26.3 (ASTER), 27.1 (Map)
Conclusions • Topographic map height values match closely with DEM models • Vertical RMSE values (Root Mean Square Error) were higher (3x) than the horizontal values especially for the older cones. • Humid climate: precipitation ranging from 2500 mm/year (east coast) to 500-800mm/year (central) winters are cool and snowy, summers are wet and cloudy • Climate conditions and vegetation cover determine high rates of erosion and rapid morphological changes, although variability is based on composition of the cones. • H/W ratios are consistent with published data for several areas of the world with differing climates although the erosional processes in the Kamachatka region are more intensive than published values. • Peaks of erosion occurred in the first stage 1 to 2 years after eruption as eruptive ashes are stripped from surface, as well as after forest fires • ASTER DEM data and topographic map data clearly supports the association of younger cones having a higher h/w ratio and slope values while the older cones have a lower h/w ratio and slope values.