Download

1 / 53
530 likes | 557 Vues
Discover the factors influencing company performance, industry dynamics, and market opportunities using Porter's Five Forces framework, SWOT analysis, and barriers to entry taxonomy. Learn how economies of scale and scope shape strategic decisions and drive industry success.

E N D
The Economics of Organization Joe Mahoney
The Sources Of Competitive Advantage • Some Industries Are More Profitable Than Others. ROE & ROA - Selected Industries, 1989 30% 25% 20% ROE 15% ROA 10% 5% 0% Pharmaceuticals Tires / Rubber Home Appliances
The Sources Of Competitive Advantage • Within Industries, Some Competitors Perform Better Than Others. ROE - Pharmaceutical Industry 1989 60% 50% 40% 30% 20% 10% 0% Amgen AMP Eli Lilly Merck Mylan Pfizer
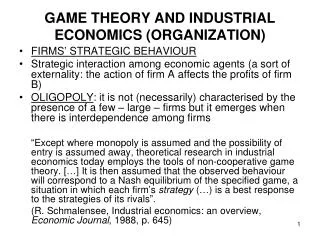
Three Factors Determining Company Performance: • Industry Context • e.g., during the last two decades, companies in the airlines industry have been less profitable than those in the pharmaceutical industry • National Context • e.g., world’s most successful consumer electronics firms are in Japan • Company Capabilities and Strategies • e.g., Wal-mart and Southwest Airlines
Supplier Power Entry Barriers Threat of Substitutes Rivalry Between Competitors Buyer Power Forces Driving Industry Performance • Porter’s Five Forces Framework
Opportunities& Threats Strengths &Weaknesses Strategy InternalFactors ExternalFactors Values OfStakeholders Values Of Management Industry Analysis Supports The Identification of Threats & Opportunities Industry Analysis • Strengths, Weaknesses, Opportunities, & Threats- “SWOT” Analysis Drivers Objectives
Efficient Markets • An efficient market (e.g., in financial markets) is one in which prices reflect information instantaneously and one in which extra-ordinary profit opportunities are thus rapidly dissipated by the action of profit-seeking individuals in the market. • (e.g.: The value of the stock should reflect the earnings ability of the firm.) • To outperform the stock market you need (1) Luck or (2) Asymmetric information.
Barriers To Entry The free entry and free exit assumption that works reasonably well for describing financial markets seems to be a premise that strays so far from our world of experience that the assumption impedes our understanding of real-world product competition. Thus, empirical evidence suggests that (risk-adjusted) ROE does NOT equalize in the long run.
A Taxonomy of Barriers to Entry: • (1) Economies of Scale • Product-specific economies of scale • lower setup costs as a percentage of total costs • more specialized machinery and tooling (e.g., Honda) • Plant-specific economies of scale • Engineers’ 2/3 rule: Since the area of a sphere or cylinder varies as two-thirds power of volume, the cost of constructing process industry plants can be expected to rise as two thirds power of their output capacity. (This rule applies to petroleum refining, cement making, iron ore reduction and steel conversion). • Also “economies of massed reserves”
A Taxonomy of Barriers to Entry: • Economies of Scale • Multi-product economies of scale (“economies of scope”) • Example: Cost (Iron, Steel) < Cost (Iron) + Cost (Steel) • Key idea: Shareable input (In this case, thermal economies in the production of iron and steel) • Modern examples: Aircraft, Automobiles, Consumer electronics, Household Appliances; Personal Computers, Software, Power Tools • Multi-plant economies of scale • Economies of multi-plant production, investment, and physical distribution.
Examples of Economies of Scope (a) Aircraft • Common wing, nose, and tail components allow several models to be leveraged using different numbers of fuselage modules to create aircraft of different lengths and passenger freight capacities by Boeing and Airbus Industries.
Examples of Economies of Scope (b) Automobiles • The Taurus platform is leveraged to provide the basis for Taurus and Mercury Sable sedans and wagons and the Ford Windstar. • (see Tully, February, 1993 Fortune article, The Modular Corporation)
Examples of Economies of Scope (c) Consumer Electronics • Over 160 variations of the Sony Walkman were leveraged by “mixing and matching” modular components in a few basic system designs. • Several upgraded models of Sony HandyCam video cameras were leveraged from an initial system design by successively introducing improved (modular) components. (“Legos”)
Examplesof Economies of Scope (d) Personal Computers • Personal computers typically consist largely of modular components like hard drives, flat screen displays, and memory chips, coupled with some distinctive components like a micro-processor chip and enclosure.
Examples of Economies of Scope (e) Software • Software designers are creating modules of routineswhich can be combined to create customized applications programs. • (The term “modularity” gained wide currency by software designers in the 1960s.)
A Taxonomy of Barriers To Entry: • (2) Experience Curve Advantages • Marvin Lieberman, a management professor at UCLA, found that in the chemical industry, on average, each doubling of plant scale over time was accomplished by an 11% reduction in unit costs. Thus, there is an “89% learning curve.” • (Note: The mere presence of an experience curve does not insure an entry barrier. Another critical prerequisite is that the experience be kept proprietary, and not available to competitors and potential entrants.)
A Taxonomy of Barriers To Entry: • Limits of “Learning Curve” Advantages: • Copying and reverse engineering of products; • Hiring a competitor’s employees; • Purchasing the know-how from consultants; • Obtaining the know-how from customers; • Experience advantages are often nullified by innovations.
A Taxonomy of Barriers To Entry: • (3) Intended Excess Capacity • Building extra capacity for the intended purpose of deterring entrants from entering the industry. (note: potential free-rider problems) • Excess capacity deters entry by increasing the credibility of price cutting as an entry response by incumbents. • “Innocent” excess capacity: Demand is cyclical; Demand falls short of expectations; Demand is expected to grow.
A Taxonomy of Barriers To Entry: • (4) Reputation • A history of incumbent firms reacting aggressively to entrants may play a role in current market interactions. • A firm’s past decisions and standard operating procedures are important considerations for predicting a firm’s actions in the near-term future.
A Taxonomy of Barriers To Entry: • (5) Product Differentiation • Brand identification and customer loyalty to incumbent products may be a barrier to potential entrants (e.g. Coca-Cola). Product differentiation appears to be an important entry barrier in the market for over-the counter drugs and in the brewing industry. • (6) Capital Requirements
A Taxonomy of Barriers To Entry: • (7) High Switching Costs of Buyers • e.g., changing may require employee retraining (e.g., IV solutions, computer software). • (8) Access to Distribution Channels • The manufacturer of a new food product, for example, must persuade the retailer to give it space on the fiercely competitive supermarket shelf via promises of promotion, and intense selling efforts to retailers.
A Taxonomy of Barriers To Entry: • (9) Favorable Access to Raw Materials and to Markets • Alcoa --> bauxite • Exclusive dealing arrangements • Favorable geographic locations
A Taxonomy of Barriers To Entry: • (10) Proprietary Technology • Product know how • Low cost product design • Patents (and other government restrictions) • (11) “Exit barriers (of incumbents) can be entry barriers (to potential entrants)”
A Taxonomy of Barriers To Entry: • High exit costs: • high exogenous and endogenous sunk costs (not just high fixed costs!) • high asset specificity • highly illiquid assets • low salvage value if exit occurs • high switching costs • low mobility of assets • credible commitments • irreversible investment • e.g., Alaskan pipeline built in 1977 at a cost of $10 billion
Bargaining Power of Buyers • Buyers compete within the industry by forcing down prices, bargaining for higher quality or more services, and playing competitors against each other. • A buyer group is powerful when: • The buyer group is concentrated (potential collusion) • The buyer group purchases large volumes relative to seller sales (e.g., HMO power buying drugs) • The product is standard and undifferentiated • Few switching costs on the part of the buyer • High switching costs on the part of the seller • Buyers pose a credible threat of backward integration
Threat From Substitutes • Substitute products increase the industry’s overall elasticity of demand and limit the potential returns of the industry by placing a ceiling on the prices that firms in the industry can profitably charge. • Companies in the coffee industry compete indirectly in the tea and soft-drink industries (all three industries serve consumer needs for drinks).
Bargaining Power of Suppliers • Suppliers can be broadly defined as the supplier of any input: Labor, Management, Technology, Physical Materials • The bargaining power of suppliers is high when: • It is dominated by a few companies and is more concentrated than the industry it sells to; • It does not contend with substitute products; • The supplier’s product is an important input to the buyer’s business; • Supplier’s products are differentiated (high switching costs for the buyer).
Degree Of Rivalry Increases When: • Industry Concentration Lower • Industry Growth Slower • Fixed Costs / Total Costs Greater • Product Differentiation Lower • Over-capacity Higher • Exit Barriers Higher • Price competition is highly unstable. Price cuts are quickly and easily matched by rivals, and once matched, they lower revenues for all firms (unless price elasticity of demand is high enough)
Degree Of Rivalry • Advertising battles, on the other hand, may well expand or enhance the level of product differentiation in the industry for the benefit for all firms. • Advertising is not necessarily a zero-sum game.
The Uses of Industry Analysis • Static Analysis - • How Do We Explain Current Rivalry and Profitability? • Dynamic Analysis - • Where Is The Industry Headed In The Future?
demand time Industries Evolve Over Time As The Relationships Between The Five Forces Change • Dynamic 5-Forces Analysis
A Sixth Force - The Presence of “Complementors” • Complementors • Industry Participants whose businesses enhance the value of yours • The Opposite of Substitutes • The Emergence of “Networks” of Organizations • Examples • Computer Manufacturers & Software Makers • Consumer Electronics & Entertainment Companies • The Central Issue • How to get “complementors” to make strategic investments which mutually benefit both companies
A Sixth Force -The Presence of “Complementors” • The biggest benefit of considering complementors is that they add a cooperative dimension to Porter’s “competitive forces” model. • “Thinking [about] complements is a different way of thinking about business. It’s about finding ways to make the pie bigger rather than fighting with competitors over a fixed pie. To benefit from this insight, think about how to expand the pie by developing new complements or making existing complements more affordable” • Brandenburger and Nalebuff Co-opetition
Empirical Testing of Structure-Conduct (Strategy)- Performance • ROE(j) = 6.3 + .050 CR4(j) + .119 [CAP/S](j) + (2.08) (1.98) 1.30 [A/S](j) +1.40 [R&D/S](j) +0.26 [GROW](j) (7.20) (2.95) (2.90) t-statistics in parentheses R-squared = .43 CR4 = 4-firm concentration ROE = return on equity R&D/S = R&D/Sales A/S = advertising/sales CAP/S = capital expenditures/Sales GROW = demand growth
Empirical Testing of Structure-Conduct (Strategy)- Performance • Model Specification • In practice, researchers estimate a statistical model of the following form where data are aggregated to the industry level: • Industry Profit Rates = f(Concentration, Barriers to Entry, Demand …)
Empirical Testing of Structure-Conduct (Strategy)- Performance • Model Specification • Multiple regression analysis seeks to evaluate the degrees to which deviations of the dependent variable (and in this course our focus has been on profit rates as the dependent variable) from its mean are “explained by” or associated with variations in each of a set of independent or explanatory variables (e.g., concentration, barriers to entry, demand, etc.)
Empirical Testing of Structure-Conduct (Strategy)- Performance • Model Specification • The nature of this association is captured by regression coefficients or parameters relating the profit rates in the industry of each independent variable, allowing us to determine the effect, for example, of a 10% increase in seller concentration on profit rates, holding all other explanatory variables constant (i.e., “ceteris paribus”)
Empirical Testing of Structure-Conduct (Strategy)- Performance • Model Specification Predicted SignReason CR4 + Higher concentration enables higher prices CAP/S + Capital-cost Barrier to entry A/S + Advertising intensity as a product differentiation barrier to entry R&D/S + Technological know-how GROW + Demand growth leads to less likely price wars
Empirical Testing of Structure-Conduct (Strategy)- Performance • Model Specification • Note that the multiple regression results are consistent with (but do not prove!) the structure-conduct-performance model. • As you probably are aware from your statistics classes, there are many potential problems that can interfere with the reliable estimation of regression models, leading to incorrect inference about the statistical significance and economic importance of explanatory variables.
Empirical Testing of Structure-Conduct (Strategy)- Performance • Three Potential Problems: (1) Mis-specification problems (2) Measurement problems (3) Identification problems
Empirical Testing of Structure-Conduct (Strategy)- Performance (1) Mis-specification Problems: • Important Variables Omitted. In our regression, the impact of substitute products, and the power of buyers and suppliers have not been included in the model specification. • Irrelevant Variables Included. If you believe fervently in “perfect capital markets” then you may question the idea of capital cost entry barriers and therefore you would question the inclusion of the independent variable [CAP/S] in the model.
Empirical Testing of Structure-Conduct (Strategy)- Performance (1) Mis-specification Problems • Model assumes a linear relationship. Since the regression assumes a linear relationship, this may turn out to be a poor approximation if some of the explanatory variables (e.g., ADV/S) influence the dependent variable (i.e., ROE) in a non-linear way. • Independent variable may not be truly independent. For example, not only can increased concentration affect profit rates but profit rates may affect industry concentration.
Empirical Testing of Structure-Conduct (Strategy)- Performance (1) Mis-specification Problems • Multicollinearity. If independent variables such as (ADV/S) and {R&D/S) are highly correlated, then the validity of the t-statistics come into question.