Download
1 / 15
160 likes | 297 Vues
This article explores the fundamental concepts of population dynamics, focusing on population distribution, abundance, and density. It analyzes geographical ranges and environmental limitations influencing these factors, alongside methodologies for estimating population size, such as the mark-recapture method. The document also delves into age structure, dispersal strategies, and the ecological significance of migration patterns. Understanding these dynamics is crucial for conservation efforts and predicting ecological responses to environmental changes.

E N D
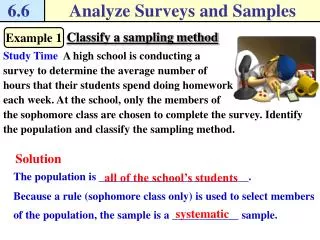
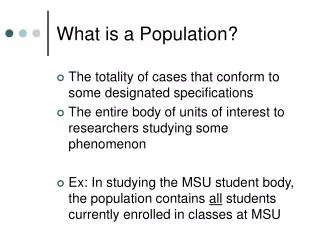
Population properties What is a population?
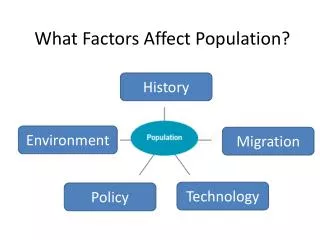
Distribution and Range • distribution • geographic range – total extent (red maple) • to N, -40 degrees C limit it • to W, dry conditions limit it • to S, ocean and wetlands limit it
Distribution patterns different at different scales • Moss (Tetraphissp.) • Microhabitat : • temperature • humidity • pH • stream banks with conifer stumps in one area provide these
Abundance = total number of individuals in a population, no. red dots • Density = number of individuals per unit area • Spatial distributions, and causes
Uniform, desert shrubs; Clumped, caterpillars patterns may indicate important ecological processes how and why hypotheses generated
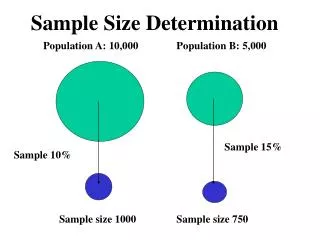
Estimating population size. • Population size (number of individuals) • 2 components: • density, the number of individuals per unit area • areaoccupied • Density area occupied = population size.
Measuring density • A total count may be possible: • if individuals can be distinctively marked • larger endangered species • For sessile organisms, local density may be determined in plots, then extrapolated to entire area occupied.
Mark-Recapture Method • Mark-recapture - used with animal populations: • initial sample, mark individuals • Release marked animals, allowed to mix • second sample, tally marked and unmarked ones
Computations • M = initial marked sample • n = size of second sample • x = number of marked animals in second sample • What is N (population size): N (Est. popln. size) = nM/x • M = 20 fish are captured, marked, and returned • n = 50 (x = 5 marked fish) • .
Most species have a dispersal stage • Sponges planula larvae • Corals, jellyfish ciliated larvae • parasitic flatworms ciliated larvae • clams veligers • barnacles small larvae • plants wind-dispersed seeds • plants animal dispersed fruits • Passive versus active/directed dispersal
Why disperse? • Reduce competition from parents, siblings • Find more food, other needed resources • Locate needed microclimate • emigration – moving out of a subpopulation • immigration – moving into a subpopulation • these movements affect population sizes and gene flows • (gene flow homogenizes gene pools) • Risks of dispersal • unknowns of new area, increased predation
Migration • a round-trip • May be local or global • Zooplankton, through a water column • Some invertebrates, mammals and birds migrate • Zooplankton daily migrate in water column, light • Earthworms overwinter deep in soil to avoid frost • Caribou migrate to arctic tundra winter, lichens • Waterfowl and shorebirds • migrate to rich northern breeding grounds, food • Conservation issues and migration • one species may need habitats in 3 different countries!
Distributions and density change over space and time – e.g., European gypsy moth