Download
1 / 14
140 likes | 240 Vues
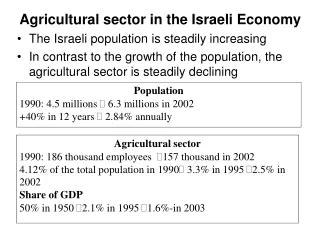
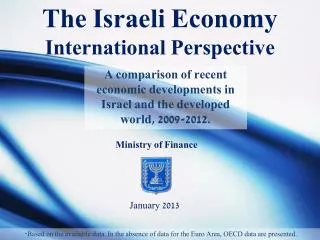
Ministry of Finance. The Israeli Economy International Perspective. A comparison of recent economic developments in Israel and the developed world, 2009-2012. January 2013. * Based on the available data. In the absence of data for the Euro Area, OECD data are presented.

E N D
Ministry of Finance The Israeli EconomyInternational Perspective A comparison of recent economic developments in Israel and the developed world, 2009-2012. January 2013 * Based on the available data. In the absence of data for the Euro Area, OECD data are presented.
GDP Growth Rate2009-2012 The cumulative GDP growth rate, in real terms. Source: OECD.
GDP Per Capita Growth Rate2009-2012 The cumulative GDP per capita growth rate, in real terms. Source: IMF, calculated by the MoF Economics and Research Department.
Investments’ Growth Rate2009-2012 The cumulative fixed capital formation growth rate, in real terms. Source: OECD.
Changes in the Debt to GDP Ratio 2009-2012 Percentage points change in the debt to GDP ratio. Source: OECD.
S&P Credit Rating Israel and select OECD countries 2010-2012 An arrow represents upgrading (green) or downgrading (red) by one notch. The numbers listed next to the country names represent the difference in notches An orange arrow represents a negative outlook. Source: S&P 6
The Israeli Labor Force International Comparison * Based on the available data. In the absence of data for the Euro Area, data are presented the OECD.
Change in the number of employees2009-2012 The rate of change in the number of employees, ages 15+ Source: OECD
The Unemployment Rate2008-2012 Israel Euro Area *Last available data for 2012. Source: Eurostat, OECD, CBS
Inequality in Israel2007-2011 Gini index for income inequality. Source: The Israeli National Insurance Institute.
Youth Unemployment2012 Ages 15-24. Source: OECD.
Changes in Youth Unemployment2009-2012 Percentage points Changes, ages 15-24. Source: OECD.
Changes in The Participation Rate2008-2012 Percentage points changes in participation rate, ages 25-64. Source: OECD.
Participation Rate2008-2012 2008 2012 Participation rate, ages 25-64. Source: OECD.