Download
1 / 68
680 likes | 688 Vues
The agricultural sector in Israel is steadily declining despite a growing population. This article explores the decrease in agricultural employment, share of GDP, and agricultural area, as well as the changing trends in crop production.

E N D
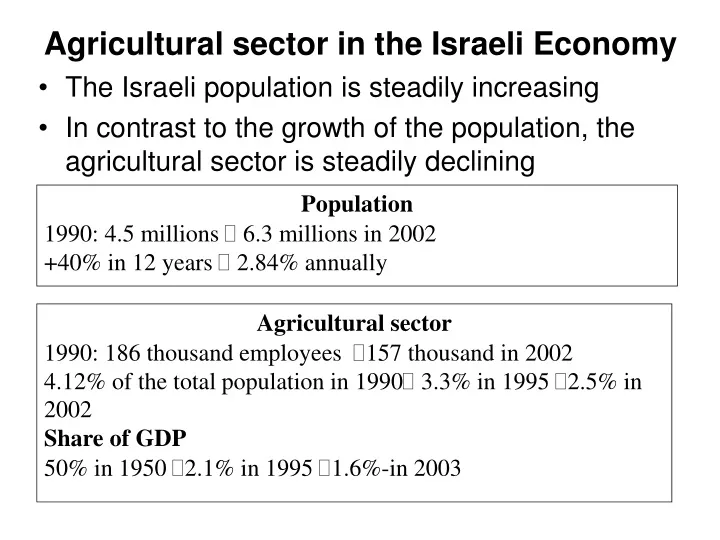
Agricultural sector in the Israeli Economy • The Israeli population is steadily increasing • In contrast to the growth of the population, the agricultural sector is steadily declining Population 1990: 4.5 millions 6.3 millions in 2002 +40% in 12 years 2.84% annually Agricultural sector 1990: 186 thousand employees 157 thousand in 2002 4.12% of the total population in 1990 3.3% in 1995 2.5% in 2002 Share of GDP 50% in 1950 2.1% in 1995 1.6%-in 2003
The size and the proportion of agricultural area from the total land area did not change much over the last decade. • The size of the land used for agricultural production declined by 5000 hectares during the last 7 years ( -1.4%). • The main changes are the increase in the proportion of area used for production of high value crops: plantation and vegetables, and the parallel decrease in the low value field crops.
Evaluation of agriculture performance • Trends in overall patterns yields and production of major crops • Area used for agricultural production and production in 1990, 1995 and 2004.
Evaluation of agriculture performance • Share of each product class in terms of land used for production and production The share of vegetable is increasing in both indicators: production and the area
Citrus • The share of area used for citrus growing crashed between 1990 and 2004. • In 1990 citrus captured 7.5% of the cultivated land and in 2004 only 5.2%. • The decline in the land used for citrus growing was 47%, and the decline in production was 67%. • In 1990 the area allocated to Shamoti was17450 hectares, in 1995 the Shamoti ‘s growing area was only 55% of the growing area in 1990. In 2002 the growing area of Shamoti orchards continued to reduce in size and it dropped to 5200 hectares. The production became smaller: from 871150 Mt in 1990 to less than 279000 Mt in 2004.
Citrus • The citrus industry is almost vanishing in Israel. • From a position of being the largest horticultural produce in 1950, the share of citrus production declined to 34.5% in 1990 and clashed into 14.2% in 2004. • The area used for agricultural production declined by 24% • The production declined by 19%. • The largest decline was in citrus: 47% in land and 67% in production • Fruits declined by 16% in area production smaller by 48%. • Vegetables enjoyed from a blossom • Vegetables - increase in production (+21%) • Area used for their production declined by 14%.
Agriculture output value by purpose • In 2002 the total output value of the agriculture sector was 15,634 million NIS The output of field crops, vegetable, cattle and poultry increased. Flower, fish and sheep production declined.
Agriculture output value by purpose • The majority of crops are marketed to the domestic market and are either targeted for consumption or to domestic industries. • Flowers and field crops are an exemption. Only 22% of the flowers grown in Israel are sold in the local markets. • Vegetables are the largest group of agricultural products in Israel. • Their production increased between 2002 and 2003. The quantity and the proportion of export of vegetables increased between 2002 and 2003
Trends in major crops production • Time series of major crops production in Israel from 1990 until 2004
Trends in major crops production • The cumulative production of fruit declined overtime. • The decline of citrus production dragged down the total production of the fruit category. • Orange production dropped from 871,150 tons in 1990 to 145,000 tons in 2004. This is a decline of almost 85% !! • When citrus are excluded from the fruits category then the production of fruits was recovering between 2002 and 2004. There is an increase in the share of fruit exported. Vegetables’ production is steadily increasing faster than other product category causing its share to increase. • The production of the avocados and persimmons is characterized by alternately output, i.e., an abundance year with production of 40,000 tons of avocados, and a consecutive year with scarcity of production. The difference between the abundance and the low production years is about 50% (20000-22000 tons). The production of persimmons also suffers from the alternately production.
Trends in major crops production • Time series of major fruits production in Israel from 1990 until 2004
Trends in major crops production • Time series of major vegetable production in Israel from 1990 until 2004
Trends in major crops production • Time series of major fields crops production in Israel from 1990 until 2004
Trade by Destination • Import and export of agriculture fresh products • The import of agricultural fresh produce is smaller than the export of fruits and vegetables. The positive balance of trade results from regulation and custom barriers aimed at protecting the local agricultural sector. • Import licenses are pre requirement for imports of fruits and vegetables, and they are issued only in two cases: 1. there is a natural disaster that causes production to be insufficient and without imports the price would sharply climb up, 2. a bilateral agreement forced the import. • The exports of fresh vegetable, potatoes, persimmon, mangoes, and flowers, are inclining. The export of citrus and watermelons decline and is about to wane. Figure 26 illustrates the exports of the selected agricultural crops.
In 2003, 76% of the export of agricultural products was shipped to a one of the European Union members. • In 2002, the share of export to the EU reached 78%. • The export of agriculture products is 2.2% from the total export of Israel. • When the Netherlands, the main market for flower export, is excluded from the export statistics, then the main markets for the Israeli fruits and vegetables are the United Kingdom (36%), Germany, and France (17% each). France was the main market for agricultural export in 1970 and 1980. • Export from Israel of selected agriculture products by the destination country in Europe
The U.S. and the Russian Federation are the two important markets beside Europe. • The U.S market is characterized by high willingness to pay for quality, but the large distance from Israel increases the transportation cost to be more than triple relative to the cost of exporting to Europe. • The decrease in demand in Europe made the U.S. to be a favorable target for Israeli exporters. The Russian economy recovers from the post communism shock making it an important outlet for Israeli produce. • The Russian market is characterized by a demand for low price produce; making it an excellent outlet for products that are unwanted in the EU. • Share of Export to E.U. countries excluding Holland
Calorie consumption balance 2003 • Annual supply per capita of food Source : Press release no 274/2004 - The central bureau of statistics 14/10/04 Ms. Shafir
Dependence in imports factor Source: Press release no 274/2004 - the central bureau of statistics 14/10/04 Ms. Shafir
Evaluation of Agri Industrial performance • Changes in import and export measured by quantity and value. The decline in the export is steeper then the growth of the import The deficit in the balance of foreign trade in beverages and tobacco is larger than the deficit of the entire food category
Evaluation of Agri Industrial performance • Import and export of fresh and processed food • The volume growing • The volume export of the agriculture processed products is declining. • The ratio of import relative to export is over 50 (quantity), and over 7 by value. • The difference results from the high value of exported food products relative to low value imports (average of 1697$ per ton and 246$ respectively). • This is blessed result of the professionalization of the agricultural sector. • In 1990, the import-export ratio was 3.3 and in 12 years this ratio, which reflect the deficit in the balance of trade, has been doubled.
Agricultural and agro industrial policies • Brief history of major policy developments • Main strategic developments occurred in the last two decades: • The eco-socio demographics structure of the Israeli farm has changed. From self employee farmers who work their fields and this is their only work into part time farmer who rely on outside cheap work. • The share of income from agriculture and agro-industry declined and a larger portion of the household income comes from services and work outside the farm. • Farmers and in particular old farmers, whose children chose no to continue with their agricultural work, sold their rights to farmers who chose to continue farming. Selling rights enabled farms to reach the critical size of farm needed to guarantee economics of scale and economics of scope.
Agricultural and agro industrial policies • Main strategic developments occurred in the last two decades: • Supply constraints became more binding- land and in particular water became scare inputs. Water usage has been administrated by setting quotas and water prices were raised. These restrictions caused growers to abandon land and leave it uncultivated. • Growing competition from other Mediterranean countries, African countries and South Americans, changes in taste of consumers. • Technology changes enabled the production of bigger yield using smaller workforce • The Israeli economics has developed into bi-polar economics: technology oriented and low technology sectors. • Young people do not wish to find themselves working in the future in agriculture. They would not mind to manage big industrial farms, but these farms are very rare in Israel
Agricultural and agro industrial policies • The collapse of kibbutz organization was caused by demographic changes and cultural changes. • The government as part of her efforts to correct the damage, which was caused by her own actions, allowed a legal change in the property rights of land for the moshavim and the kibbutzim. • Israel signed the WTO agreement and as part of its implementation subsidies were banned. The new budget of the agricultural ministry states clearly that direct and indirect subsidies will decline gradually until its termination. • The retailing system in Israel became very concentrated and the bargaining power of the three big retailing chains grow enormously, while the growers did not succeeded in building countervailing power.
Agricultural and agro industrial policies • These changes and forces if analyzed according to the five forces model of Porter call for a major strategic change. • The agricultural sector should have focused either in strategy aimed at developing a technology that will enable production in lower cost than the competition or differentiating the produce, • Alternative strategy - Produce only high value corps where the high education and the technological sophistication would be an advantage. • Increase the share of high tech R&D firms: seed, breeding genetics, agbiotech • Decline the share of traditional industries: citrus, cotton wheat.
Governmental Support • Governmental support is classified into: • Direct support, which is the complete set of regulation that apply to the agricultural sector, and the budget that reflects the share of importance attributed to the sector • Indirect support, which applies to laws and regulation allowing the farmers to be exempt from restriction that are imposed on other sectors
Direct support: MOAG budget for 2004 875 NIS. 66 million NIS were directed to subsidizing investment. High priority investments- building new dairy burns and replacing irrigation system 258 million NIS Subsidizing the cost of water and compensating farmers for the restrictions and lower water quotes 247 million NIS governmental training and inspection services, 166 million NIS R&D 52 million NIS damage and disaster insurance fund 75 million NIS The Galilee law 11 million NIS were allocated to promotional activities of export (1.26%). Indirect Support: The indirect support is realized in five domains: Exemption from antitrust law Exemption from collecting (and paying) VAT, Import barriers (custom, regulations) Subsidizing the cost of land leases In 2005, the new law canceled the historic exemption except for dairy production and imports which are still negotiated and the poultry industry. The support for the agricultural export has been reduces dramatically since 1995 mainly as a result of complying with GATT agreement, which were ratified in 1994
Economic situation and its effects on the agricultural and food sectors • The average salary in January 2004 was 7550 (2% higher than 2004). The average salary of an employee working in agriculture was 4542 NIS, which is 40% of the average. • The average cost of leaving, which is calculated as the basic expenditures to food, housing, health insurances, education and cultural activities, was 7500 NIS for a family of four. If both adults worked in agriculture they could not support themselves (In that level of salaries the burden of tax is about 15%) • The number of Israeli employees was in January 2005 2.39 million and the number of foreign employees declined to 65.4 thousand. Only 9400 Palestinians work in Israel
Water • Water scarcity is a main limiting factor of the Israeli agriculture. Three main water resources: • Rainfall - 610 mm (154 years average). Arid years receive around 300 mm of rain. The annual average rain is in the range of 800 mm, in the north, to 25 mm in the Negev. • Sea of Galilee, from which an average annual quantity of 400 million cubic meters is pumped to the Negev • The coastal and mountain aquifers supply the remaining demand. • The sharp growth in the population of Israel attributed to immigration and natural growth of population increased the demand for water while water supply stayed constant.
Water • Analysis of the consumption patterns indicates that in contrast to the agricultural demand, the per capita consumption of the private sector barely increased, and the industry’s consumption is constant.
Input, output and deficit in the market of water for the years 1997-2003
Four measures aimed at handling the water crisis: • Increasing the price of water • Setting quotas of water to the agricultural sector • Carrying out an advertising campaign aimed at encouraging households to save water • Building infrastructure for water desalination.
Price • Price of water to agricultural usages • 1948-1972 constant price • 1973 + 5% • 1976 +26% • 1980 + 20% • 1981 -13% • 1986 +15% • 1991 +24% • The increase in price between 1995 and 2002 was larger then the incline in price index and the following devaluation in the currency exchange rate.
Industry pays about $0.22-$0.25, and individuals pay on average $1 per m3. • The NIS was deflated by 42% relative to the Euro and by 33% relative to the USD.
Administrative steps reduction of quotas • Water quantities and usages are determined by the water director by according to the water act from 1959. • The ministry of agriculture allocates the quantity needed to be saved between the different crops by employing a strategy aimed at: • minimizing the long-term damage to the produce and • allocation of water according to their marginal value of production. • First reduction 1980 -10% . • Second reduction 2001: 50% (490-450 millions m3) • Te direct annual damage to the economy: 0.5 billion USD. • 9000 hectares of orchards were uprooted • 15,800 employees lost their work
Water reduction (in %) in main crops and livestock 1999-2003
Employment • The employment structure of those engaged in agriculture has changed dramatically over the last century. • From an idealistic industry who set the principles of self employment to be its central ideological theme into a capitalistic society. • The number of self-employed farmers, mostly members of cooperatives decreased and their labor has been substituted by hired workers.
Farm structure Rural Population and Villages 1999-2203
Farm structure • Farm structure is characterized by a large share of cooperative community villages. • The cooperative sector leases the lion share of the Israeli rural areas and dominates the agricultural production even though their own social structure and objectives changed dramatically over the last 40 years. • There are three forms of cooperative community villages: • Kibbutz • Cooperative moshav • Moshavim • Kibbutz and are collective moshav are cooperatives founded to work the land. • A moshav is a village of 20-100 farms. • In the 1940-1960 agriculture, agro-industry and food processing were the major bread winners of the kibbutz, cooperative and non-cooperative moshavim. Nowadays the income from agriculture is about 20% of their income.
Agro-industrial structure overview • The total output of the food industry was 231 billion NIS and it increased to 233.6 billion NIS. Food , Beverages are the second largest industry – 6 times bigger than the agricultural sector. • The share of the output of the food industry is 13.6%, second after chemicals 18.27%. • Food and products plus the beverages and tobacco industry, which capture 3.16%, account for 16.76% of the industry output.
Export via sea versus via air transport • Israel’s agricultural export must be transported via sea or air to its target markets. • This is a shortcoming relative to Spanish, Italian and French exporters who ship their produce by trucks. • The long duration of sea shipments (3-5 days on the sea) causes deterioration of quality. • Cost of sea and air transportation
Export via sea versus via air transport • Potatoes, onions, melons and even avocadoes that redeems up to $1200 CIF can not be shipped via air. • The quality of potatoes, onions and avocado is not affected by the sea shipments. Melons suffered from quality problems caused by the long duration of sea shipments. • High value produce such as herbs, which have short shelf life are sent by air
Economic and socio demographic indicators • High School education: 47%-53% of individuals succeed in finalizing high school with a matriculation certificate. • Universities and colleges - 45% of the individuals holding a matriculation certificate apply to universities and colleges. • The incomes of agricultural sector employees is low (the second low after tourism) • Agriculture is not a desired career for high educated young people. • Israel is a technological oriented country. • The blooming of high tech and biotech industries in addition to the growing size of the financial and services sectors lowers the image (and the support) of the agricultural sector. • The infrastructure fall behind OECD standards and exceptions such as medicine and universities are still enjoying the investments done 1960. • The infrastructure of roads did not catch up with the increase demand for vehicles. • The obvious results is that almost all Israel is one big traffic jam . • The influence of land transportation on agricultural trade, import and export is insignificant.
Technology Adoption • Observing adoption patterns of durable goods suggests that Israelites are more than happy to adopt new technologies. • The rate of adoption and the diffusion level of new technologies is one of the highest in the western world. • Comparing the diffusion at 2002 to the U.S shows that the adoption in Israel of cell phones was faster and the diffusion was higher by 50% relative to the U.S. • The adoption of communication technology and IT by Israeli flower growers enabled the direct merchandising of flowers via the net between Israeli growers and the Dutch flower markets. • The majority of growers (more than 900 from 1000 active growers) are using computers, broad band connection.
Marketing system • Distribution channels and marketing system for horticultural products