Download
1 / 63
630 likes | 652 Vues
Explore how Norway managed structural adjustment, export specialization, and growth in a diversified resource-based economy. Discover the unique case of Norway, avoiding the Dutch disease and leveraging natural resources for long-term prosperity.

E N D
Structural Adjustment, Export Specialization, and Growth in Diversified Resource Based Economies: The Case of Norway Thorvaldur Gylfason
Outline of presentation Norway and the Dutch disease The macroeconomics of oil A brief digression on OPEC Empirical cross-country evidence on natural resources and growth But, Norway is different
1 Neither Dutch nor a disease • Discovery of oil and natural gas off-shore round 1960 • Ensuing upswing in exports of natural gas led to appreciation of Dutch guilder • Hurt manufacturing exports • Raised concerns about de-industrialization • Problem proved short-lived • But name stuck
The Dutch disease: Some symptoms • Overvaluation of currency • Exchange rate volatility • Excessive wages • Greenland • Centralized wage bargaining • Hurts level or skews composition of exports away from manufacturing • May also hurt foreign direct investment
Exports of goods and services 1960-2000 (% of GDP) What does experience show? Norway’s exports have hovered around 40% of GDP since 1960, with only a weak tendency to rise over time
Foreign direct investment 1967-2000 (gross, % of GDP) Since 1970s, Norway has attracted less gross FDI than the Netherlands
Manufacturing exports 1962-2001 (% of total exports) In Norway, oil exports have crowded out other exports krone for krone relative to GDP since the mid-1970s
Why these things may matter Exports and FDI are good for growth Openness to trade and investment stimulates imports of goods and services, technology, ideas, know-how Too much primary export dependence and too little manufacturing for export may hurt growth But Norway has done very well
Unemployment 1980-2000 (% of labor force) In Norway, stabilization policy has been well managed and joblessness has been low by European standards
Government consumption 1960-2000 (% GDP) In Norway, general government consumption has increased, but not to extravagant levels, at least not yet
GNP per capita 1962-2001 (current USD, Atlas method Since mid-1970s, Norway has grown faster than the Netherlands
2 Macroeconomics of oil and other resources Natural resources x Economic growth
Macroeconomics of oil and other resources Natural resources x Economic growth What is x?
Five main channels of transmission 1. The Dutch disease Exchange rates, wages, volatility Hurts level or composition of exports and FDI 2. Rent seeking Protectionism, cronyism, corruption 3. False sense of security Poor quality of policies and institutions 4. Neglect of education 5.Not enough investment Social capital
Crowding out Hence, natural capital may crowd out • Foreign capital • Social capital • Human capital • Real capital Matter of taste whether these mechanisms are viewed as additional symptoms of the Dutch disease or as separate channels of transmission
Natural resource abundanceand economic structure Hypothesis: Dependence hurts growth, even if abundance may help Resource poor, resource dependent (Chad, Mali) Resource rich, resource dependent (OPEC) Resource dependence, b Resource poor, resource free (Jordan, Panama) Resource rich, resource free (Canada, USA) Resource abundance, N
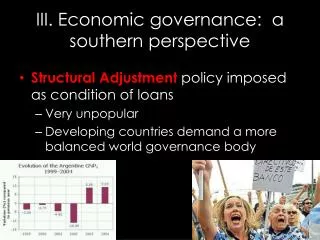
3 A quick look at OPEC Nigeria has been stagnant since independence in 1960: No growth Per capita growth 1965-1998 • Iran and Venezuela: -1% per year • Libya: -2% • Iraq and Kuwait: -3% • Qatar: -6% Why?
Background: A quick look at OPEC King Faisal of Saudi Arabia (1964-1975) would hardly have been surprised: “In one generation we went from riding camels to riding Cadillacs. The way we are wasting money, I fear the next generation will be riding camels again.”
Background: A quick look at OPEC Lee Kwan Yew,founding father of Singapore (1959-1991), would not have been surprised either: “I thought then that wealth depended mainly on the possession of territory and natural resources, whether fertile land ..., or valuable minerals, or oil and gas. It was only after I had been in office for some years that I recognized ... that the decisive factors were the people, their natural abilities, education and training.”
Increasing awareness that oil brings risks If ... oil revenue is managed well, it can educate, heal and provide jobs for ... the people. But oil brings risks as well as benefits. Rarely have developing countries used oil money to improve the lives of the majority of citizens or bring steady economic growth. More often, oil revenues have caused crippling economic distortions and been spent on showy projects, weapons and Paris shopping trips for government officials. New York Times, 1 August 2000.
Is OPEC an exception? No, this seems to be a general pattern. Of 65 natural resource abundant countries 1970-1998, only four had • Investment of more than 25% of GDP • Per capita GNP growth of more than 4% per year They are: Botswana, Indonesia, Malaysia, Thailand
But there is an exception: Norway The problem is not the existence of natural wealth as such ... but rather the failureto avert the dangers that accompany the gifts of nature Norway is, so far, a success story Government takes in 80% of oilrent and invests it mostly in foreign securities No signs of damage to growth potential, at least not yet (but some worry!)
4 Natural capital and growth: The evidence Review a few of the empirical findings of the new literature on natural resources and economic growth Present cross-country evidence Individual historical case studies support the results Stress linkages among natural capital and other kinds of capital as well as growth
Real capital and growth r = -0.38 Lesotho r = rank correlation Natural capital crowds out real capital Guinea Bissau Niger Chad
Real capital and growth r = 0.65 Botswana China Quantity and quality Investment is good for growth 1% 4% An increase in investment by 4% of GDP goes along with an increase in per capita growth by 1% per year Niger Nicaragua
Interpretation of results Growth Growth Investment = + Resources Resources Investment
Human capital and growth r = -0.63 Finland New Zealand Uruguay Natural capital crowds out human capital Saudi Arabia
Human capital and growth r = 0.72 Thailand Education is good for growth Finland New Zealand Jamaica An increase in secondary-school enrolment by 25-30% of each cohort goes along with an increase in per capita growth by 1% per year Notice diminishing returns to education
Interpretation of results Growth Growth Education = + Resources Resources Education
Interpretation of results Natural-resource-based industries are generally less high-skill labor intensive and less high-quality capital intensive than others, and so • confer few external benefits • distort comparative advantage • impede learning by doing, technical advance, and economic growth
Financial capital and growth r = -0.68 Switzerland Japan Natural capital crowds out financial capital China New Zealand
Financial capital and growth r = 0.66 Financial depth is good for growth: Money greases the wheels of commerce and production Japan Indonesia Switzerland Jordan
Financial capital and growth r = 0.66 This helps explain why inflation hurts growth: Inflation reduces financial depth and thereby inhibits growth Japan Indonesia Switzerland Jordan
Interpretation of results Growth Growth Financial depth = + Resources Resources Financial depth
Foreign capital and growth r = -0.32 Netherlands Switzerland Botswana Sweden Natural capital crowds out foreign capital Guinea Bissau
Foreign capital and growth r = 0.62 Norway Foreign direct investment is good for growth Netherlands Papua New Guinea Madagascar
Foreign trade and growth r = 0.42 Korea Malaysia Foreign trade is also good for growth Belgium Guinea Bissau
Interpretation of results Growth Growth FDI = + Resources Resources FDI
Social capital and growth 7 African countries where saving is 5% of GDP and per capita growth is -1% per year Brazil Natural capital crowds out social capital Inequality of access to education and land: Same pattern Increase in natural capital by 3% of national wealth goes along with an increase in Gini by 1 point. r = 0.41 Notice cluster
Social capital and growth r = -0.50 Korea China Equality is good for growth: No sign here that too much equality hurts growth Norway Brazil South Africa Sierra Leone
Social capital and growth r = -0.50 Korea China Equality is good for growth Norway Brazil South Africa An increase in Gini index by 12 points goes along with a decrease in per capita growth by almost 1% per year Sierra Leone
Interpretation of results Growth Growth Inequality = + Resources Resources Inequality
Social capital and growth, again r = -0.42 Finland New Zealand Again, natural capital crowds out social capital Zambia Indonesia