Distraction Study Phases I and II
460 likes | 619 Vues
Distraction Study Phases I and II. Published May 2001 Prepared by UNC-CH Highway Safety Research Center. Managing Driver Distraction. Why Don’t We All Keep Our Eyes on the Road and Our Minds on Driving?. Types of Distraction. Visual Auditory Physical Cognitive.

Distraction Study Phases I and II
E N D
Presentation Transcript
Published May 2001 Prepared by UNC-CH Highway Safety Research Center
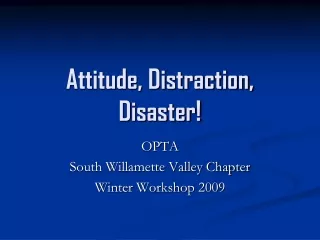
Managing Driver Distraction Why Don’t We All Keep Our Eyes on the Road and Our Minds on Driving?
Types of Distraction • Visual • Auditory • Physical • Cognitive
What Do We Mean by “Driver Distraction”? Distraction happens when a driver is slow to recognize a potential hazard because something inside or outside the vehicle draws the driver’s attention away from the road.
How Do Distractions Affect Driving Ability? • Drivers react more slowly • Drivers often fail to recognize potential hazards • Drivers reduce their “margin of safety”
Magnitude of The Problem Research suggests 25% of crashes are distraction-related Social and economic costs for these crashes approach an estimated $40 billion annually
Overall Study Goal To identify, using both crash and field data, the major sources of driver distraction that result in crashes and near misses, and to understand the relative importance of these distracters.
Project Tasks • Analysis of 1995-1999 CDS crash data • Analysis of narrative data from the CDS and North Carolina crash reports • Collection and analysis of real-world driving data to determine the frequency and severity of driving distractions
Part I Examining Crash Data
“Mining” Existing Data • Analysis of 1995-1999 crash data • Analysis of crash reports
National Accident Sampling SystemCrashworthiness Data System • Annual probability sample of 5,000 police-reported crashes • Based on passenger vehicles towed from the scene or with airbag deployed • Professional crash investigators examine vehicles, drivers, witnesses
Some Examples From Police Crash Reports: • Driver stated he was on his cell phone and writing down some notes. Due to this he never saw the red light which he ran causing the collision. • Driver states she reached down in the floor of her vehicle to pick up the CD player and when she looked up everyone was stopped.
More Examples From Police Crash Reports. . . . • Vehicle 1 was stopped. Driver took his foot off the brake to light a cigarette and struck Vehicle 2 in the rear. • Vehicle 1 had a drink which started to spill so the driver tried to grab the drink, causing her to turn off the road to the right and strike a fire hydrant. • Driver of Vehicle 3 had taken his attention from traffic ahead to obtain a map out of his glove box. He did not observe traffic slowing and this caused (the accident).
Driver Attention Status of Crash-involved Vehicles Weighted 1995-1999 CDS Data
Phase I Conclusions • Old and new sources of driver distraction • Difficulty collecting good data - potential reporting biases • Need for further research • Laboratory, crash, and observation studies • How common are various distractions • Increase public education (include novice drivers) • Role of legislation is still being debated
Part II In-Vehicle Observation Data
Phase II - On-road driving data • Installed video recording equipment in cars of volunteer subjects • 2 sites - North Carolina, Pennsylvania • 70 subjects total • 5 age categories, equal male & female • Coded 3 hours from 1 week of data per subject, using VideoPro software
Research Questions • How often drivers engage in behaviors that might be distracting • Under what conditions drivers engage in such behaviors • Differences among drivers by age and gender • Relative severity of consequences of these behaviors
Cell phone / pager Eating / drinking Radio / tape / CD Smoking Other occupants Reading Grooming External events Internal events Taxonomy of Driver Distractions
Occupants in vehicle (number, age) Light conditions (light, gray, dark) Weather conditions (good, bad) Travel lanes Traffic level (light, moderate, heavy) Intersection Vehicle movement (stopped, moving) Vehicle turning Contextual Variables
Hands on steering wheel Eyes on roadway/driving task Vehicle position in travel lane Sudden braking Outcome Measures . . . But no measure of cognitive demand
VideoPro Coding
Using cell phone Eating/drinking/preparing Manipulating radio, etc. Reading Grooming Smoking Other occupant Conversing Internal distraction External distraction 34.3 71.4 91.4 40.0 45.7 7.1 38.0 77.1 100.0 85.7 Frequencies of Distractions While Driving % of Subjects % of Total Driving Time 1.3 4.6 1.4 0.7 0.3 1.6 0.9 15.3 3.8 1.6
% of Subjects Affected by a Potential Distraction When Vehicle Was Moving
% of Total Time While Driving Engaged in a Potentially Distracting Activity
Cell Phone Use Effects on Driving Performance ** ** * * p < .05 **p < .01
Conclusions: Need to learn how to safely manage everyday distractions before introducing new technologies into our vehicles There are many distractions Distractions can be deadly
Published report available at:www.aaafoundation.org It’s not always easy to stay focused and keep your eyes on the road
The AAA Foundation for Traffic Safety is a 501(c)(3) public charity located in Washington, DC that is dedicated to research and education about the causes of traffic crashes. It is supported by donations from AAA/CAA Clubs, AAA/CAA members, and other organizations associated with the American Automobile Association/Canadian Automobile Association.