Download
1 / 52
520 likes | 637 Vues
Why Has Global Warming Paused? Argonne National Laboratory March 22, 2013 William Happer Princeton University. CO2 has been demonized because it allegedly causes Catsrophic Global Warming. Der Spiegel, Jan. 2013.

E N D
Why Has Global Warming Paused? Argonne National Laboratory March 22, 2013 William Happer Princeton University
CO2 has been demonized because it allegedly causes Catsrophic Global Warming
Der Spiegel, Jan. 2013 Klimawandel: Forscher rätseln über Stillstand bei Erderwärmung
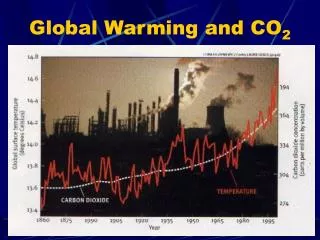
After a long pause, or slight decline from the dust bowl maximima • of the 1930’s, temperatures started to rise rapidly in the 1980’s. • Temperatures have been stable since about 1998, although CO2 levels • have continued to rise.
Satellite temperature measurements show little warming http://www.drroyspencer.com/latest-global-temperatures/
El Nino Normal La Nina
The earth is almost always warming or cooling. • A strong warming phase began about 200 years ago, long before CO2 levels began to increase.
John Muir, first President of The Sierra Club From John Muir's notes about his first visit to Glacier Bay in October, 1879. “Glacier Bay is undoubtedly young as yet. Vancouver's chart, made only a century ago, shows no trace of it, though found admirably faithful in general. It seems probable, therefore, that even then the entire bay was occupied by a glacier of which all those described above, great though they are, were only tributaries.” From “Travels in Alaska, Chapter X”
Could much of the warming from 1950 to 2000 have been due to natural causes and not CO2 ? • Solar activity? • Cosmic rays? • Pacific Decadal Oscillation? • Atlantic Meridional Oscillation? • Etc., etc. Let’s review the basic physics!
Saturation of the CO2 Band • At current CO2 levels, the radiative forcing of CO2 is not proportional to the concentration, [CO2], but is approximately proportional to ln [CO2]. This is the celebrated “logarithmic response.”
Warming from Doubling CO2 (Climate Sensitivity) Direct Effect of CO2: about 1 C IPCC “Most Probable”: 3 C Most of the large discrepancy is due to supposed positive feedback from water vapor. Even the 1 C may be too big!
2349 cm -1 frequency too high for greenhouse warming 666 cm -1 (Satan’s number) greenhouse warming 1388 cm-1 no changing dipole moment, no absorption or emission
Attenuation Coefficient (e-foldings / length) N is the number density of CO2 molecules, and seg is the cross section of the transition from a lower state g to an upper state e; Geg is the lineshape function. Line strength (in cm) neg = frequency (in cm-1) of the transition, Deg = the electric dipole matrix element, Eg = lower-state energy, T = absolute temperature, k = Boltzmann’s constant, h = Planck’s constant, c = speed of light, T = absolute temperature. Partition function
Normalized line shapes A Lorentzian line shape meg = collision broadening of line; n= emission/absorption frequency A Voigt line shape
Hedy Lamarr Frequency-Hopping Patent (to defeat torpedo-jamming by Nazi ships) • Lamarr-Anthiel system hopped over 88 frequencies (piano keyboard). US Patent 2,292,387 • CO2 can hop to any of several thousand vibration-rotation frequencies at each collision.
Schwartzschild equation for radiant intensity from earth. Planck brightness Attenuation rate Optical depth to space
Downwelling Flux at the Surface Planck Brightness Optical Depth from Surface to Altitude z
Using Voigt Profiles Increases The Radiative-Forcing Increment From Doubling CO2 By A Factor ~1.4 But far wing absorption from Voigt profiles does not exist!
Voigt Line Shapes Don’t Work in Far Wings! Hartmann, Boulet and Robert, Collisional Effects on Molecular Spectra, Elsevier, 2008