COORDINATION CHEMISTRY (Complexation in Solution)
COORDINATION CHEMISTRY (Complexation in Solution). Bruce Herbert Geology & Geophysics. Sampling the Aqueous Phase. Soil Water. http://ianrpubs.unl.edu/fieldcrops/g964.htm. Sampling the Aqueous Phase. Soil Water.


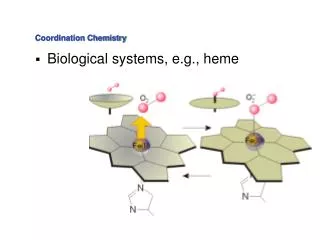
COORDINATION CHEMISTRY (Complexation in Solution)
E N D
Presentation Transcript
COORDINATION CHEMISTRY(Complexation in Solution) Bruce Herbert Geology & Geophysics
Sampling the Aqueous Phase Soil Water http://ianrpubs.unl.edu/fieldcrops/g964.htm
Sampling the Aqueous Phase Soil Water Soil water is classified into three categories: (1) excess soil water or gravitational water, (2) available soil water, and (3) unavailable soil water. http://ianrpubs.unl.edu/fieldcrops/g964.htm
Sampling the Aqueous Phase Soil Water Retention Curves In unsaturated soils, water is under tension and it takes energy to remove it from the soil. As the water content of a soil decreases from the saturation point, the tension used to hold water increases. The relationship of soil water content and soil water tension is represented in the Figure. Curves like Figure 6 are called water retention or soil water characteristic curves. They are different for each soil because of differences in soil textures and structures. http://ianrpubs.unl.edu/fieldcrops/g964.htm
Sampling the Aqueous Phase Soils • Soil solution is the water and gaseous phase held in interstial pores at various tensions (negative pressures) • Soil solution samplers have to use negative pressure (suction) to retrieve soil solution. Different tensions will retrieve different volumes and chemistry of samples • Typical instruments: the lysimeters • Tension lysimeter • Zero-tension lysimeter • Vacuum extractor • Pan and deep pressure vacuum lysimeters • Porous ceramic samplers
Sampling the Aqueous Phase Soils • Other methods • Column displacement • Centrifuge samples to extract solution • Characterize saturated pastes. This is the only method if the porous media is dry. • Generally, all samplers are porous ceramic or teflon bodies that can hold a tension. • Preferably at the tension equal to the soil's field moisture capacity. • This creates a suction in the sample which opposes capillary pressure. www.usyd.edu.au/.../sphysic/waterlab/field.htm
Using Samplers • Samplers need to be installed a year or so before use to equilibrate system. • Effects of spatial variability • Small size of samplers may not incorporate large heterogeneities • Soils with macropores may require both tension and zero-tension lysimeters to sample water in bulk soil and macropores • Application of vacuum: volatile components may be lost such as organics or CO2(g). This could change pH or redox • pH changes of 0.28 to 0.44 pH units are common due to CO2(g) degassing • Ceramic cups can adsorb anions and possibly leach cations. Clean ceramic cups with dilute acid with extensive washings with DI water • Teflon cups are less reactive than ceramic www.usyd.edu.au/.../sphysic/waterlab/field.htm
Sampling the Aqueous Phase Groundwater • Chemistry of water samples reflect the conditions in the groundwater over the entire screened interval. Samples can be taken from depth-integrated or depth-specific wells. • Depth-integrated: Useful in identifying regional patterns in GW chemistry, but misses variations over small depth scales. These variations are integrated into one sample. • Depth-specific: Useful in studying chemical processes in detail or producing 3D data sets. A: Depth-integrated well.B: Depth-specific well.C: Nested piezometers for depth-specific sampling.D: Depth-specific sampling using inflated packers to isolate a particular zone.
Groundwater Sampling • Sampling is concerned with contamination of the groundwater by drilling operations with drilling fluids, gravel pack or casing materials. It may take a long time for these disturbances to diminish. • Drilling mud can often change the cation exchange of the solid matrix, changing the cation distribution in GW. • Stagnant water in the well is usually flushed from the well before a sample is taken. Usually 3 or so well volumes are flushed from the well before a sample is taking. Too much flushing is wasteful and may result in drawing water from other formations. • When brought to the surface, GW is exposed to different physio-chemical conditions than in the subsurface. Major differences in O2 and CO2 can really affect GW chemistry. • O2 can redox of elements; CO2 affects alkalinity, carbonates, pH.
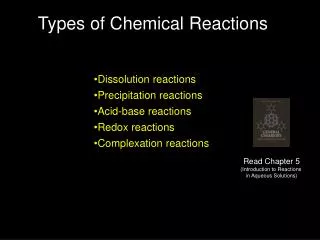
WHY IS CHEMICAL SPECIATION SO IMPORTANT? • The biological availability (bioavailability) of metals and their physiological and toxicological effects depend on the actual species present. • Example: CuCO30, Cu(en)20, and Cu2+ all affect the growth of algae differently • Example: Methylmercury (CH3Hg+) is readily formed in biological processes, kinetically inert, and readily passes through cell walls. It is far more toxic than inorganic forms. • Solubility and mobility depend on speciation.
Effect of free Cu2+ on growth of algae in seawater. Figure 6-20 from Stumm & Morgan
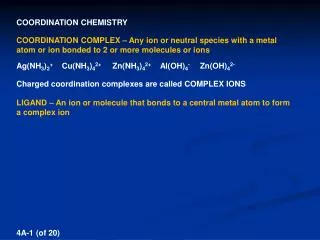
DEFINITIONS Coordination (complex formation) - any combination of cations with molecules or anions containing free pairs of electrons. Bonding may be electrostatic, covalent or a mix. Central atom (nucleus) - the metal cation. Ligand - anion or molecule with which a cation forms complexes. Multidentate ligand - a ligand with more than one possible binding site. Chelation - complex formation with multidentate ligands. Multi- or poly-nuclear complexes - complexes with more than one central atom or nucleus.
MULTIDENTATE LIGANDS Oxalate (bidentate) Ethylendiaminetetraacetic acid or EDTA (hexadentate) Ethylendiamine (bidentate)
Chelation Polynuclear complexes Sb2S42- Hg3(OH)42+
DEFINITIONS - II Species - refers to the actual form in which a molecule or ion is present in solution. Coordination number - total number of ligands surrounding a metal ion. Ligation number - number of a specific type of ligand surrounding a metal ion. Colloid - suspension of particles composed of several units, whereas in true solution we have hydration of a single molecule, atom or ion.
FORMS OF OCCURRENCE OF METAL SPECIES 10 Å 100 Å 1000 Å
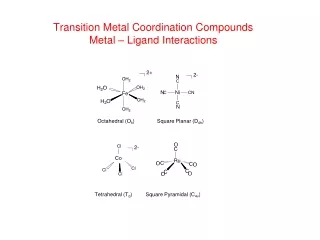
Coordination Numbers CN = 2 (linear) CN = 4 (square planar) CN = 4 (tetrahedral) CN = 6 (octahedral) Coordination numbers 2, 4, 6, 8, 9 and 12 are most common for cations.
STABILITY CONSTANTS MEASURE THE STRENGTH OF COMPLEXATION Stepwise constants MLn-1 + L MLn Cumulative constants M + nL MLn n = K1·K2·K3···Kn
STABILITY CONSTANTS MEASURE THE STRENGTH OF COMPLEXATION For a protonated ligand we have: Stepwise complexation MLn-1 + HL MLn + H+ Cumulative complexation M + nHL MLn + nH+ The larger the value of the stability constant, the more stable the complex, and the greater the proportion of the complex formed relative to the simple ion.
STABILITY CONSTANTS FOR POLYNUCLEAR COMPLEXES mM + nL MmLn mM + nHL MmLn + nH+ If m = 1, the second subscript on nm is omitted and the expression simplifies to the previous expressions for mononuclear complexes.
Titration of H+ and Cu2+ with Ammonia and Tetramine (trien) Figure 6-3 from Stumm & Morgan
HYDROLYSIS The waters surrounding a cation may function as acids. The acidity is expected to increase with decreasing ionic radius and increasing ionic charge. For example: Zn(H2O)62+Zn(H2O)5(OH)+ + H+ Hydrolysis products may range from cationic to anionic. For example: Zn2+ZnOH+ Zn(OH)20 (ZnO0) Zn(OH)3- (HZnO2-) Zn(OH)42- (ZnO22-) May also get polynuclear species. Kinetics of formation of mononuclear hydrolysis products is rather fast, polynuclear formation may be slow.
METAL HYDROLYSIS • The tendency for a metal ion to hydrolyze will increase with dilution and increasing pH (decreasing [H+]) • The fraction of polynuclear products will decrease on dilution • Compare Cu2+ + H2O CuOH+ + H+ log *K1 = -8.0 Mg2+ + H2O MgOH+ + H+ log *K1 = -11.4
At infinite dilution, pH 7 so CuOH+ = (1 + 10-7/10-8)-1 = 1/11 = 0.091 MgOH+ = (1 + 10-7/10-11.4)-1 = 1/25119 = 4x10⁻⁵ Only salts with p*K1 < (1/2)pKw or p*n < (n/2)pKw will undergo significant hydrolysis upon dilution. Progressive hydrolysis is the reason some salts precipitate upon dilution. This is why it is necessary to add acid when diluting standards.
POLYNUCLEAR SPECIES DECREASE IN IMPORTANCE WITH DILUTION Consider the dimerization of CuOH+: 2CuOH+ Cu2(OH)22+ log *K22 = 1.5 Assuming we have a system where: CuT = [Cu2+] + [Cu(OH)+] + 2[Cu2(OH)22+] we can write: So [Cu2(OH)22+] is clearly dependent on total Cu concentration!
HYDROLYSIS OF IRON(III) Example 1: Compute the equilibrium composition of a homogeneous solution to which 10-4 (10-2) M of iron(III) has been added and the pH adjusted in the range 1 to 4.5 with acid or base. The following equilibrium constants are available at I = 3 M (NaClO4) and 25°C: Fe3+ + H2O FeOH2+ + H+ log *K1 = -3.05 Fe3+ + 2H2O Fe(OH)2+ + 2H+ log *2 = -6.31 2Fe3+ + 2H2O Fe2(OH)24+ + 2H+ log *22 = -2.91 FeT = [Fe3+] + [FeOH2+] + [Fe(OH)2+] + 2[Fe2(OH)24+]
Optional Now we define: 0 = [Fe3+]/FeT; 1= [FeOH2+]/FeT; 2= [Fe(OH)2+]/FeT; and 22= 2[Fe2(OH)24+]/FeT.
Optional This last equation can be solved for 0 at given values of FeT and pH. The remaining values are obtained from the following equations: These equations can then be employed to calculate the speciation diagrams on the next slide.
Example 2: Compute the composition of a Fe(III) solution in equilibrium with amorphous ferric hydroxide given the additional equilibrium constants: Fe(OH)3(s) + 3H+ Fe3+ + 3H2O log *Ks0 = 3.96 Fe(OH)3(s) + H2O Fe(OH)4- + H+ log *Ks4 = -18.7 Fe3+ log [Fe3+] = log *Ks0 - 3pH Fe(OH)4- log [Fe(OH)4-] = log *Ks4 + pH
FeOH+ Fe(OH)3(s) + 3H+ Fe3+ + 3H2O log *Ks0 = 3.96 Fe3+ + H2O FeOH2+ + H+ log *K1 = -3.05 Fe(OH)3(s) + 2H+ FeOH2+ + 2H2O log *Ks1 = 0.91 log [FeOH2+] = log *Ks1 - 2pH Fe(OH)2+ Fe(OH)3(s) + 3H+ Fe3+ + 3H2O log *Ks0 = 3.96 Fe3+ + 2H2O Fe(OH)2+ + 2H+ log *2 = -6.31 Fe(OH)3(s) + H+ Fe(OH)2+ + H2O log *Ks2 = -2.35 log [Fe(OH)2+] = log *Ks2 - pH
Fe2(OH)24+ 2Fe(OH)3(s) + 6H+ 2Fe3+ + 6H2O 2log *Ks0 = 7.92 2Fe3+ + 2H2O Fe2(OH)24+ + 2H+ log *22 = -2.91 2Fe(OH)3(s) + 4H+ Fe2(OH)24+ + 4H2O log *Ks22 = 5.01 log [Fe2(OH)24+] = log *Ks22 - 4pH These equations can be used to obtain the concentration of each of the Fe(III) species as a function of pH. They can all be summed to give the total solubility.
Complexation & the HSAB Concept • Metal ions can be titrated by ligands in the same way that acids and bases can be titrated. • According to the Lewis definition, metal ions are acids because they accept electrons; ligands are bases because they donate electrons. • We can use the concepts of hard/soft acid and bases to predict propensity and stability of different complexation reactions. • Like complexes like
Metal Complexationand Toxicity Representative data illustrating the relationship between metal effects and metal ion characteristics. Responses range widely from enzyme inhibition (lactic dehydrogenase, LDH) (22) to toxicity of cultured turbot cells (23) to acute lethality of a crustacean (amphipod) (27) to chronic toxicity of mice (1) and Daphnia magna (8). http://ehpnet1.niehs.nih.gov/docs/1998/Suppl-6/1419-1425newman/abstract.html
Complexation & the HSAB Concept Ionic potential Misono Softness
Figure 6-4a from Stumm and Morgan: Predominant pH range for the occurrence of various species for various oxidation states
Figure 6-4b from Stumm & Morgan: The linear dependence of the first hydrolysis constant on the ratio of the charge to the M-O distance (z/d) for four groups of cations at 25°C.
Correlation between solubility product of solid oxide/hydroxide and the first hydrolysis constant. Figure 6-6 from Stumm & Morgan
Hard ions (class A) small highly charged d0 electron configuration electron clouds not easily deformed prefer to form ionic bonds Soft ions (class B) large low charge d10 electron configuration electron clouds easily deformed prefer to form covalent bonds PEARSON HARD-SOFT ACID-BASE (HSAB) THEORY
Pearson’s Principle - In a competitive situation, hard acids tend to form complexes with hard bases, and soft acids tend to form complexes with soft bases. In other words - metals that tend to bond covalently preferentially form complexes with ligands that tend to bond covalently, and similarly, metals that tend to bond electrostatically preferentially form complexes with ligands that tend to bond electrostatically.
ION PAIRS formed solely by electrostatic attraction ions often separated by coordinated waters short-lived association no definite geometry also called outer-sphere complexes COORDINATION COMPLEXES large covalent component to bonding ligand and metal joined directly longer-lived species definite geometry also called inner-sphere complexes ION PAIRS VS. COORDINATION COMPLEXES
STABILITY CONSTANTS OF ION PAIRS CAN BE ESTIMATED FROM ELECTROSTATIC MODELS For 1:1 pairs (e.g., NaCl0, LiF0, etc.) log K 0 - 1 (I = 0) For 2:2 pairs (e.g., CaSO40, MgCO30, etc.) log K 1.5 - 2.4 (I = 0) For 3:3 pairs (e.g., LaPO40, AlPO40, etc.) log K 2.8 - 4.0 (I = 0) Stability constants for covalently bound coordination complexes cannot be estimated as easily.
COMPLEX FORMATION AND SOLUBILITY • Total solubility of a system is given by: [Me]T = [Me]free + [MemHkLn(OH)i] • Solubilities of relatively “insoluble” phases such as: Ag2S (pKs0 = 50); HgS (pKs0 = 52); FeOOH (pKs0 = 38); CuO (pKs0 = 20); Al2O3 (pKs0 = 34) are probably not determined by simple ions and solubility products alone, but by complexes such as: AgHS0, HgS22- or HgS2H-, Fe(OH)+, CuCO30 and Al(OH)4-.
Calculate the concentration of Ag+ in a solution in equilibrium with Ag2S with pH = 13 and ST = 0.1 M (20°C, 1 atm., I = 0.1 M NaClO4). Ks0 = 10-49.7 = [Ag+]2[S2-] At pH = 13, [H2S0] << [HS-] because pK1 = 6.68 and pK2 = 14.0 so ST = [HS-] + [S2-] = 0.1 M
[S2-] = 9.1x10⁻³ M [Ag+]2 = 10-49.7/10-2.04 = 10-47.66 [Ag+] = 10-23.85 = 1.41x10⁻²⁴ M Obviously, in the absence of complexation, the solubility of Ag2Sis exceedingly low under these conditions. The concentration obtained corresponds to ~1 Ag ion per liter. What happens if we take 100 mL of such a solution? Do we then have 1/10 of an Ag ion? No, the physical interpretation of concentration does not make sense here. However, an Ag+ ion-selective electrode would read [Ag+] = 10-23.85 nevertheless.
Estimate the concentration of all species in a solution of ST = 0.02 M and saturated with respect to Ag2S as a function of pH (in other words, calculate a solubility diagram). [Ag]T = [Ag+] + [AgHS0] + [Ag(HS)2-] + 2[Ag2S3H22-] Ks0 = [Ag+]2[S2-], but [S2-] = 2ST so Ks0 = [Ag+]2 2ST Ag+ + HS- AgHS0 log K1 = 13.3 AgHS0 + HS- Ag(HS)2- log K2 = 3.87 Ag2S(s) + 2HS- Ag2S3H22- log Ks3 = -4.82