Download
1 / 24
240 likes | 391 Vues
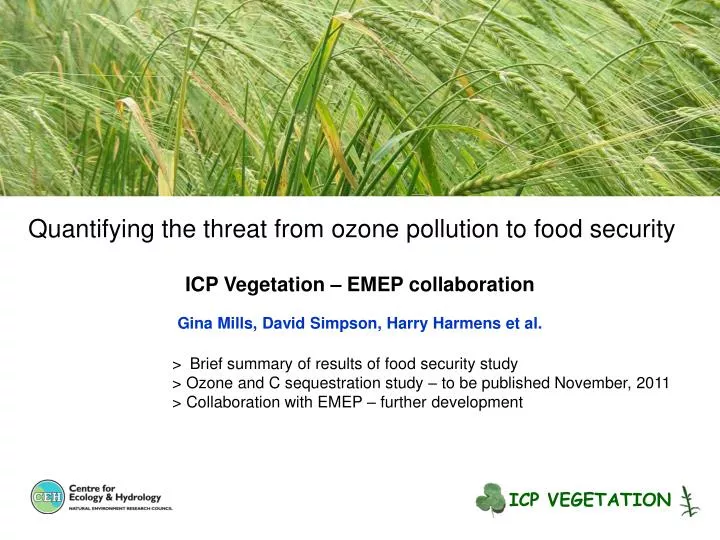
Quantifying the threat from ozone pollution to food security ICP Vegetation – EMEP collaboration Gina Mills, David Simpson, Harry Harmens et al. > Brief summary of results of food security study > Ozone and C sequestration study – to be published November, 2011

E N D
Quantifying the threat from ozone pollution to food security ICP Vegetation – EMEP collaboration Gina Mills, David Simpson, Harry Harmens et al. > Brief summary of results of food security study > Ozone and C sequestration study – to be published November, 2011 > Collaboration with EMEP – further development ICP VEGETATION
ICP Vegetation State of Knowledge Report • Report to be published in late September • How does O3 damage crops? • By how much? • Which crops are sensitive? • Effects in N and S Europe • Case studies, including S Asia Pre-publication copies available ICP VEGETATION
Ozone indicators for vegetation • O3 conc. in air (e.g. AOT40) • Stomatal ozone flux (e.g. POD6) Takes into account: • [O3] in air • temperature • light • humidity (VPD) • soil moisture • plant development
Health vs vegetation indicators, 2000 SOMO35 AOT40 Ozone flux (POD6)
Predicting impacts of ozone on food security Dose-response relationships from ozone-exposure experiments across Europe* Crops: wheat and tomato Maps of ozone flux (POD6) and crop production for 2000 National Emissions Scenario, current legislation used for 2000 and 2020 for EU27+CH+NO Models of ozone transfer to vegetation and uptake by stomata (DO3SE – EMEP model) Numbers represent “best estimates” * Mills et al, Atmospheric Environment (2011)
Quantifying impacts on wheat production Ozone flux (POD6) in 2000 Wheat production (2000) * Assumes adequate soil moisture
Economic losses for wheat in Europe 2000 2020 Losses are in million Euro per 50 x 50 km grid square: 0 – 0.01 0.01 – 0.1 0.1 – 1.0 1.0 – 2.5 2.5 – 5.0 > 5 * Assumes adequate soil moisture available
Economic losses for wheat, highest 10 countries ICP VEGETATION
Effects on wheat in EU27+CH+NO, NAT scenario 1 In wheat-growing areas 2 Estimated for each grid square from the mean t/ha per country ICP VEGETATION
Quantifying impacts on Tomato production Ozone flux (POD6) in 2000 Tomato production (2000) *Irrigation assumed *squares with > 3 t production shown ICP VEGETATION
Economic losses for Tomato in Europe 2000 2020 Economic loss in million Euro per 50 x 50 km grid square: 0 – 0.01 0.01 – 0.1 0.1 – 1.0 1.0 – 2.5 2.5 – 5.0 > 5 * Irrigation assumed, squares with > 3 t production shown
Economic losses for Tomato, highest 10 countries ICP VEGETATION
Effects on Tomato in EU27+CH+NO, NAT scenario * Estimated for each grid square from the mean t/ha per country ICP VEGETATION
Next report: O3 and C sequestration, including feedbacks to climate To be published, November, 2011 • Review of current knowledge • Impacts on carbon storage in grasslands and forests for 2000 and 2040, using climate and O3data from EMEP to run the:: • DO3SE model • JULES model (Sitch et al., 2007. Nature) Increased radiative forcing by CO2 and O3 Less CO2 uptake O3 Less C in roots ICP VEGETATION
Future ICP Vegetation - EMEP Collaboration MSc-West We would benefit from: + Please! • New scenarios for ex-Post analysis – use in food security and C sequestration analysis • Inputs to forthcoming ecosystems services study (2013/14) • Further upgrading of EMEP model to reflect new developments in flux modelling • Further collaboration on development of methodology, including in EU-ECLAIRE project ICP VEGETATION
Future ICP Vegetation - EMEP Collaboration • CIAM • We remain concerned that GAINS runs are based on health impacts (SOMO35) alone. Vegetation (including impacts on food security and C sequestration) may remain unprotected in large areas of Europe. • Inclusion of flux-based methodology into next version of GAINS • TFIAM • We welcome inputs and are happy to contribute as needed • MSc-East • Further testing/comparing performance EMEP Heavy Metal Model (spatial resolution at 5 km x 5 km?) with measured concentrations in mosses at a high spatial resolution (ca. 6000 moss sites in 2005) ICP VEGETATION
Summary of results • Wheat • The area of medium-high ozone fluxes includes the main wheat growing areas in central and NW Europe • Economic losses in 2000 were predicted to be 3.2 billion Euro • Whereas the area of highest fluxes is predicted to decrease by 2020, ca. 24 million ha of wheat remain at risk of damage, with losses still predicted to be 2 billion Euro. • Tomato • The area of highest fluxes coincides with the areas of greatest production in S Europe; other tomato growing areas such as the Netherlands have lower, yet still damaging fluxes • Economic losses in 2000 were predicted to be 1 billion Euro. • In 2020, ozone flux is predicted to decrease in the tomato growing areas, reducing economic losses to 0.6 billion Euro.
AOT40-based economic impact assessment for wheat 2000 2020 Losses are in million Euro per 50 x 50 km grid square: 0 – 0.01 0.01 – 0.1 0.1 – 1.0 1.0 – 2.5 2.5 – 5.0 > 5
Quantifying impacts on wheat Ozone flux (POD6) in 2000 AOT40 in 2000
Wheat yield loss in 2000 AOT40 POD6 Losses are in million Euro per 50 x 50 km grid square: 0 – 0.01 0.01 – 0.1 0.1 – 1.0 1.0 – 2.5 2.5 – 5.0 > 5
Wheat: NAT Scenario, EU27+CH+NO * Indicative figures only
Grouping of crops by sensitivity of yield to ozone. Values in brackets represent the percentage decrease in yield at a 7h mean ozone concentration of 60 ppb compared to that at 30 ppb.
Flux method To predict impacts on food security we model ozone uptake by stomata using the Jarvis approach: gsto = gmax *[min(fphen, fO3)]* flight * max{fmin, (ftemp * fVPD * fSWP)} Separate functions for effects of phenology, ozone, light, temperature, VPD (humidity) and soil moisture (SWP) on stomatal conductance Species-specific value See Pleijel et al., 2007, Atmos. Envt. 41, 3022, for further details