Haywood County Schools Writing Assessment Proficiency Analysis for 2007
180 likes | 281 Vues
Explore the changes in testing methods for elementary, middle, and high schools in Haywood County. Detailed breakdowns of AYP percentages and results in various subjects for different student demographics.

Haywood County Schools Writing Assessment Proficiency Analysis for 2007
E N D
Presentation Transcript
George Chapman Superintendent AYP for 2007 Haywood County Schools
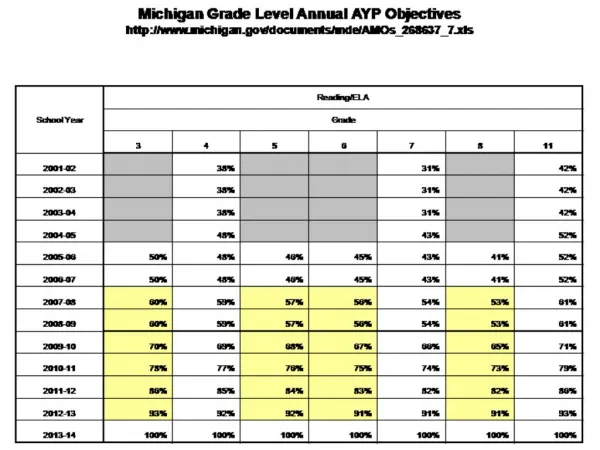
Grades 3, 5, 8 Less than 45 Special Education & Hispanic students Writing Assessment-Proficient if scored 3, 4, 5, or 6 Grades 3, 4, 5, 6, 7, 8 45 or more Special Education & Hispanic students Writing Assessment-Proficient if scored 4, 5, or 6 CHANGES IN TESTINGIn Past Years
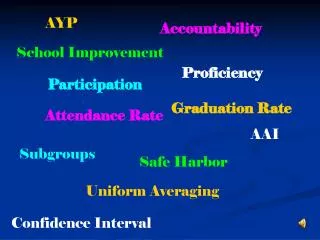
Ways to Achieve AYP • Status** • Confidence Interval • Safe Harbor** • Projection ** 2-year/3-year Average
2007 East Side AYP Percentages Count for African Low Socio AYP White American Hispanic Econ SWD 79% 85 95 85 63 94 79 Math 83% 88 95 85 83 88 69 LArts
2007 Sunny Hill AYP Percentages Count for African Low Socio AYP White American Hispanic Econ SWD 79% 87 100 87 64 93 83 Math 83% 87 92 83 94 87 62 LArts
2007 Haywood Junior AYP Percentages Count for African Low Socio AYP White American Hispanic Econ SWD 79% 86 94 83 39 94 82 Math 83% 86 93 83 91 85 50 LArts
2007 Haywood High AYP Percentages Count for African Low Socio AYP White American Hispanic Econ SWD 75% 88 83 88 50 94 86 Math 90% 90 94 88 96 88 46 LArts
2007 System Wide K-8 AYP Percentages Count for African Low Socio AYP White American Hispanic Econ SWD 79% 86 96 85 55 94 82 Math 83% 86 93 84 88 86 60 LArts
2007 System-Wide 9-12 AYP Percentages Count for African Low Socio AYP White American Hispanic Econ SWD 75% 89 83 87 48 94 86 Math 90% 89 94 87 96 85 40 LArts
All Tested Count for AYP White African American Hispanic Low Socio-Econ SWD 84.6% 88.9% 95.7% 85.8% 83.3% 87.5% 50.0% GATEWAY Results 2006 - 2007 - Algebra 1
All Tested Count for AYP White African American Hispanic Low Socio-Econ SWD 91.2% 94.7% 94.6% 94.4% 100.0% 92.9% 61.0% GATEWAY Results 2006 - 2007 - English II
All Tested Count for AYP White African American Hispanic Low Socio-Econ SWD 94.9% 95.8% 100.0% 94.1% 100.0% 94.0% 63.6% GATEWAY Results2006 - 2007 - Biology I
Good Standing • Target • School Improvement 1 • School Improvement 1 - Improving • School Improvement 2 • School Improvement 2 - Improving • Corrective Action • Corrective Action - Improving • Restructuring 1 • Restructuring 1 - Improving • Restructuring 2 • Restructuring 2 - Improving