Download

1 / 35
350 likes | 425 Vues
This study explores the method to determine the largest true structures in the Universe, examining filamentary structures and their significance. It delves into the history of filamentary structures, the validity of filaments, and presents findings from surveys like The Las Campanas Redshift Survey. The methodology involves creating coarse-grained maps, defining clusters using the "friends of friends" approach, and analyzing filamentarity using Shapefinder statistics. Shuffling techniques are also employed to differentiate between real large-scale structures and chance formations. The study concludes that the scale of the largest real structures in the Universe is around 80 h-1 Mpc, emphasizing the statistical homogeneity at this scale.

E N D
A method to determine the largest true structures in the Universe Suketu P. Bhavsar Dept. of Physics & Astronomy & Honors Program University of Kentucky Cal Poly Pomona - April 27, 2006
A brief history of filamentary structure. Are the filaments real? The Las Campanas Redshift Survey. A largest scale for physical filaments? Method and Results No “real” structure beyond 80Mpc. Outline
North Galactic Cap – Seldner et al. The Lick galaxy counts
angular position and radial velocity are plotted for each galaxy The “stick man” - Slice from the CfA2 redshift survey – a bubbly universe
angular position and radial velocity are plotted for each galaxy the “wall”CfA2 six slices superposed –
CfA North and South slices How do we get this -
COBE results after subtracting galaxy and dipole ...........From this?
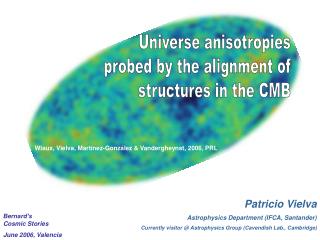
Microwave sky image from WMAP Actually.......... from this?
Collaborators Somnath Bharadwaj (IIT Kharagpur) Jatush V. Sheth (IUCAA) What are the scales of the largest real filamentary features in the LCRS?
Embed a 1 h-1 Mpc x 1 h-1 Mpc rectangular grid on each slice. Generate “coarse grained” map by filling neighbouring cells of occupied cells. This creates larger structure, as the filling factor, FF, increases for a slice. Use “friends of friends” to define features for at each value of the FF. Method Identifying Filamentary Structure
Coarse Graining • Coarse grained structure is generated. • As coarse graining proceeds the filling factor, FF, for the slices increases.
“friends of friends” (Turner & Gott 1977) define clusters • Clusters (different colors) defined by fof are shown at several values of filling factor, FF
In 2D, the shape of an object can be characterised by: perimeter (L) and area (S). A dimensionless Shapefinder statistic, filamentarity, F (0 ≤ F ≤ 1), can be constructed from L and S to describe the shape of a cluster. Extremes: F = 0 ...... circle F = 1 ...... a line Filamentarity (Bharadwaj et al. 2000).
The Average Filamentarity F2 Large clusters contribute most to the overall morphology of structure F2 is a measure of filamentarity weighed by the area of the cluster We obtain the average filamentarity, F2 , of a slice as a function of FF.
Shuffling • Shuffling is a statistical method to create a fake slice. It maintains clumping on scales below a fixed length while breaking apart structures beyond that length.
Creating a “Glass pattern” Shuffling: an experiment with a Poisson distribution of points
Large scale structures that are real, break, and do not re-form when Shuffled Large scale structures that are visual, i.e. due to chance, are formed again and again due to statistical chance. Consequences of Shuffling
Plot F2versus FF for the original data and the Shuffled slices for L from 10 Mpc to 100 Mpc The excess of F2 in the LCRS above its values for Shuffled slices gives the REAL filamentarity through the range of FF for each slice. Determining the number of real filaments at various values of L
The -3o slice Shuffled at L = 70 and 80 Mpc • The shuffled slices at L=70 and 80 Mpc look statistically similar to the original LCRS slice.
The scale of the largest real structures in the LCRS are ~80 h-1 Mpc The filament void network is statistically repeated on scales > 80-1 Mpc. This is the scale on which the universe is statistically homogeneous Conclusions