Download
1 / 36
360 likes | 379 Vues
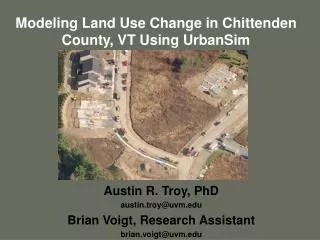
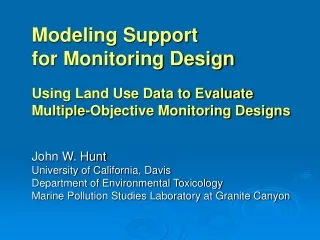
Modeling Support for Monitoring Design Using Land Use Data to Evaluate Multiple-Objective Monitoring Designs John W. Hunt University of California, Davis Department of Environmental Toxicology Marine Pollution Studies Laboratory at Granite Canyon.

E N D
Modeling Support for Monitoring Design Using Land Use Data to Evaluate Multiple-Objective Monitoring Designs John W. Hunt University of California, Davis Department of Environmental Toxicology Marine Pollution Studies Laboratory at Granite Canyon
California’s Surface Water Ambient Monitoring ProgramStatewide Assessment Framework(Stressors)
SWAMPers: Val Connor, Emilie Reyes, Karen Worcester, Dave Paradies, Karen Taberski, Tom Suk, Rusty Fairey, Max Puckett, Cassandra Lamerdin, Bev van Buuren, Terry Flemming, Rainer Hoenicke UC Davis: Brian Anderson, Bryn Phillips, Ron Tjeerdema UC Santa Cruz: Brent Haddad, Brian Fulfrost, Karen Holl, Carol Shennan, Russ Flegal
Nutrients Metals Industrial Sediment Pesticides Pathogens
Hg Mines Grazing Urban Poultry Fertilizer and Pesticide Applications Nutrients Metals Industrial Sediment Pesticides Pathogens
Complexity Precipitation Hydrology Terrain Soils Vegetation Land Cover Land Management
State Water Resources Control Board 9 Regional Water Quality Control Bds CALFED Bay-Delta Program California Coastal Commission Santa Monica Mountains Conservancy SF Bay Conservation and Development Commission State Coastal Conservancy State Lands Commission California Integrated Waste Management Board US Environmental Protection Agency Region 9 California Departments of Boating and Waterways Conservation Fish and Game Food and Agriculture Forestry and Fire Protection Health Services Parks and Recreation Pesticide Regulation Toxic Substances Control Transportation Water Resources Bond Fund Grantees California NPS Program Plan: 28 State Agencies SWAMP
All of these agencies use water quality information to make resource management decisions. Monitoring to meet multiple objectives
Water Quality Information • Decision: What? Who? How? When? • Assessment questions • Ecological attributes • Spatial and temporal scales • Indicators and benchmarks • Data quality and level of uncertainty • Monitoring objectives • Monitoring designs • Sampling plans
Assessment Questions and Legal (Public) Mandates • Beneficial use benchmarks (CWA § 303[c]) • Standards attainment (§ 305[b]) • Impaired water body listing (§ 303[d]) • Cause & source identification (§ 303[d], 305[b]) • Management implementation (§ 303, 314, 319) • Program effectiveness (§ 303, 305, 402, 314, 319) • Basin planning activities (California Water Code)
Assessment Questions • Status of waterways (SWRCB) • Trends over time (SWRCB) • Causes of impairment (Reg Bds) • Sources of stressors (Reg Bds) • Program evaluation (All)
Assessment Questions • Status of waterways (statewide) • Trends over time (statewide) • Causes of impairment (local) • Sources of stressors (watershed) • Program evaluation (All)
Assessment Questions • Status of waterways (probabilistic) • Trends over time (fixed site) • Causes of impairment (gradient) • Sources of stressors (tributary network) • Program evaluation (All, over time)
Control (N+1) Focal (N) Mechanistic (N+1) Hierarchies based on Process Rates Landscape Slow Ecosystem Community Time Population Species Organism Fast Small Large Space
Hierarchies based on Process Rates Landscape Slow Ecosystem Flow of Inference Community Time Population Species Organism Fast Small Large Space
Hierarchies based on Process Rates Hydrologic Region Slow Watershed Flow of Inference River Time Tributary Stormdrain Furrow Fast Small Large Space
Integrate regional data into statewide assessments Status and Trends probabilistic sampling: stratification, clustering, proportional, spatially balanced Regional Cause and Source: gradients and networks arrayed around probability sites from statewide design Design criteria for regional assessments?
Aggregate Up
Testing Candidate Designs against Expected Values from Models
Testing Candidate Designs against Expected Values from Models EPA BASINSsoftware system • SWAT:predicts pollutant yields from land use • WinHSPF:water concentrations from NPS loadings • PLOAD:annual average NPS loads per chemical • QUAL2E:pollutant transport within stream channels.
Testing Candidate Designs against Expected Values from Models EPA BASINSsoftware system • SWAT:predicts pollutant yields from land use • WinHSPF:water concentrations from NPS loadings • PLOAD:annual average NPS loads per chemical • QUAL2E:pollutant transport within stream channels. • Georeferenced • Calibration • Validation
Target Stressors • Copper in streambed sediment • Chlordanes in streambed sediment • Nitrate in stream water • Diazinon in water and sediment
Target Stressors • Copper in streambed sediment • Chlordanes in streambed sediment • Nitrate in stream water • Diazinon in water and sediment • frequently on 303[d] lists throughout the state; • commonly measured in monitoring programs; • range of physico-chemical properties; • multiple source activities; • previous water quality modeling studies.
Fill the Reach File 3 stream segments with expected stressor concentrations.
Fill the Reach File 3 stream segments with expected stressor concentrations. Virtual sampling: Apply iterations of monitoring designs m
Fill the Reach File 3 stream segments with expected stressor concentrations. Virtual sampling: Apply iterations of monitoring designs m
Fill the Reach File 3 stream segments with expected stressor concentrations. Virtual sampling: Apply iterations of monitoring designs m
Monitoring Design Evaluation Compare known impairment (model derived) with observed impairment (from virtual sampling): • What proportion of “known” standards exceedences were observed? • What proportion of “known” tributary pathways were discovered?
Intended Benefits of this Approach • Process to consolidate disparate types of data: land use layers with water quality measurements; • Maps to target future monitoring; • Evaluation of potential monitoring designs.
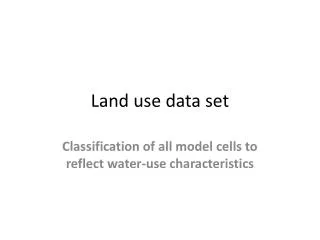
Pilot Study Land Use: Pesticide Application Water Quality: In-stream pesticides and toxicity Central Coast
Land Use and Water Chemistry 10 SA 1 Log OPs in Water (ug/L) 0.1 0.01 0.001 10 100 1000 10000 Log Chlorpyrifos plus Diazinon Applied (kg)
Land Use and Water Toxicity 1.00 0.80 0.60 C. Dubia Survival 0.40 0.20 0.00 0 2000 4000 6000 8000 10000 12000 Diazinon + Chlorpyrifos Applied (lbs)
Land Use and Sediment Toxicity 1.20 1.00 0.80 0.60 Hyalella Survival 0.40 0.20 0.00 0 2000 4000 6000 8000 10000 12000 Organophosphate PesticidesApplied (lbs)