Download
1 / 16
160 likes | 308 Vues
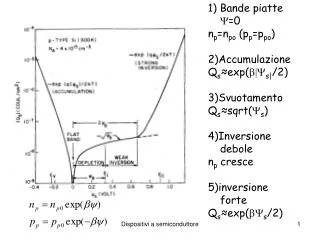
Higher BMI (body mass index) is linked to greater brain atrophy in 700 MCI and AD patients, and in healthy elderly. (N=113, critical P-value: 0.011). ADNI (N=587,critical P-value: 0.025). Ho, Raji et al., Neurobiology of Aging, 2010.

E N D
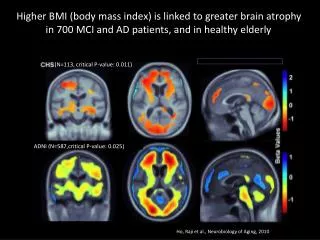
Higher BMI (body mass index) is linked to greater brain atrophyin 700 MCI and AD patients, and in healthy elderly (N=113, critical P-value: 0.011) ADNI (N=587,critical P-value: 0.025) Ho, Raji et al., Neurobiology of Aging, 2010
Higher BMI associated with similar pattern of atrophy in the subgroup of 476 MCI subjects CHS, N=77; critical P-value: 0.009 ADNI N=400, critical P-value: 0.019 Ho and Raji et al., Neurobiology of Aging, 2010
Surprisingly, this is still true in AD:Higher BMI is linked with more severe (~2%) brain volume reduction 188 AD patients Critical P-value: 0.012 Ho and Raji et al., Neurobiology of Aging, 2010
AIM 1 Implications • First study to show that higher BMI is correlated with regional profiles of brain atrophy in both healthy and cognitively impaired persons • Results were reproduced in two independent samples • Strength of the BMI-brain atrophy relationship in healthy control, MCI, and AD emphasizes the need to consider obesity as risk modifying for cognitive impairment • Controlling body fat content even in late life may reduce risk for dementia (interventional studies are needed)
Obesity-associated gene (FTO) relates to brain structure • Background: • FTO (fat mass and obesity-associated) gene highly expressed in the brain Frayling et al., 2007 • Carried by 46% of Western Europeans • BMI is highly genetically influenced (genetic factors explaining 50-90% of the variance in BMI) • Associated with a ~1.2 kg weight gain and ~1 cm waist circumference increase – carriers eat, on average, 200 more calories a day • Carriers (2 copies of the variant) were 67% more likely to be obese than non-carriers Frayling et al., 2007 • Used proxy (tagging SNP) that has 98.8% accuracy in predicting risk allele • PNAS paper (Ho 2010): this very common obesity-associated risk allele is associated with lower brain volume in similar areas affected by obesity • Study Design: Cross-sectional study using TBM in 206 ADNI controls (healthy elderly)
Carriers of obesity risk allele, in FTO, have greater atrophyin frontal and occipital lobes (206 ADNI controls) Critical P=0.00131 Ho et al., PNAS, 2010
Higher BMI associated with widespread pattern of atrophy Ho et al., PNAS, 2010 Critical P=0.0202
White matter burden does not explain effect of FTO risk allele on brain atrophy (N=169) Critical P=0.0016 Ho et al., PNAS, 2010
Depending on your FTO genotype, BMI seems to affect youin a different way 1 or 2 risk alleles N=128, critical P=0.016 2 risk alleles N=33; critical P=0.0022 1 risk allele N=95; critical P= 0.0113 *Does not pass FDR at 5% in non-carriers (N=78) Ho et al., PNAS 2010
What can be done about this? We found that the level of atrophy was linked with high levels of homocysteine in the blood (N=732, all ADNI subjects) – vitamin B/folate supplements may reduce this RajagopalanNeuroReport2011
Homocysteine levels in the blood explain a substantial proportion of brain atrophy (N=356 MCI subjects only) – dietary folate supplements may reduce this (testable in a trial) RajagopalanNeuroReport2011
What else can be done about atrophy? Higher physical activity correlated with greater brain volume Ho and Raji et al., Human Brain Mapping, 2010 Critical P=0.0003
What can be done about atrophy? Higher educational level is correlated with greater temporal lobe volume Ho and Raji et al., Human Brain Mapping, 2010 Critical P=0.0021
Genome-wide association study Where in the genome is a common variant (carried by >1% of the population) associated with a brain measure? One SNP 600,000 SNPs P-value Caudate Volume Change Position along genome A/A C/C A/C Genotype GWAS = Finding common variants which explain the heritability of a trait.
Discovered Genes for Caudate Volume - ADNI top hit (dopamine pathway gene) was replicated in young adults Stein Mol Psych 2011
Replication through collaboration http://enigma.loni.ucla.edu 83 members from 9 countries, GWAS meta-analysis in 19 cohorts (N>7,000)