Download
1 / 45
450 likes | 687 Vues
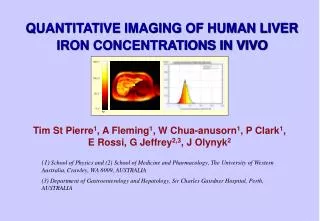
QUANTITATIVE IMAGING OF HUMAN LIVER IRON CONCENTRATIONS IN VIVO. Tim St Pierre 1 , A Fleming 1 , W Chua-anusorn 1 , P Clark 1 , E Rossi, G Jeffrey 2,3 , J Olynyk 2. Declaration of competing interests.

E N D
QUANTITATIVE IMAGING OF HUMAN LIVER IRON CONCENTRATIONS IN VIVO Tim St Pierre1, A Fleming1, W Chua-anusorn1, P Clark1, E Rossi, G Jeffrey2,3, J Olynyk2
Declaration of competing interests • Three of the investigators on this project are involved with a commercial venture based on non-invasive measurement of liver iron concentrations • Tim St Pierre • Paul Clark • Wanida Chua-anusorn
Standard methods of assessingthe body iron burden • Ferritin serum assay • Needle biopsy of the liver
Proton transverse relaxation rate (R2) image and distribution Clark et al, Mag Res Imaging 18 (2000) 431-438.
Liver R2 images and distributions healthy volunteer 3 iron loaded subjects with sequentially increasing liver iron concentrations
R2 image analysis of human liver samples Iron loaded liver tissue: dissection outline
R2 image analysis of human liver samples Clark et al, Magn Reson Med 49 (2003) 572-575
R2 image analysis of human liver samples Clark et al, Magn Reson Med 49 (2003) 572-575 Mean R2 vs iron concentration for 32 cubes of liver dissected from a single iron loaded liver post mortem.
Measurement of liver R2 in vivo Needle biopsy samples a few milligrams of tissue from the right hand side of the liver
Relationship between <R2> in right hand side of liver and needle biopsy iron concentration (dry wt) St Pierre et al (2005) Blood 105, 855-861
Sensitivity and specificity of R2-LIC measurements to biopsy LIC measurement * Olivieri NF, Brittenham GM. Blood. 1997; 89: 739-761
Measurement of R2 standards St Pierre et al (2005) Blood 105, 855-861 R2 vs paramagnetic Mn2+ concentration for the same series of phantoms measured on 13 different 1.5T MRI scanners
Reproducibility of liver R2 measurements on 2 MR scanners Random error: 7.7% Systematic error: 1.2% St Pierre et al, NMR in Biomed 2004; 17, 446-458
Using age and LIC at diagnosis to predict fibrosis grade in HH Olynyk et al (2005) Am. J. Gastroenterol 100, 837
Using age and LIC at diagnosis to predict fibrosis grade in HH Olynyk et al (2005) Am. J. Gastroenterol 100, 837
Relationship of R2 distribution with liver histology 250 mm Perl’s Stain 250 mm Reticulin Stain Clark et al, Magn Reson Med 49, (2003) 572-575
Relationship of R2 distribution with liver histology 250 mm Perl’s Stain 250 mm Reticulin Stain Clark et al, Magn Reson Med 49, (2003) 572-575
Relationship of R2 distribution with liver histology 250 mm Perl’s Stain 250 mm Reticulin Stain Clark et al, Magn Reson Med 49, (2003) 572-575
R2 distribution and liver biopsy histology Non-cirrhosis LIC = 10.2 mg/g DW R2 = 99 ± 20 Cirrhosis LIC = 12.6 mg/g DW R2 = 132 ± 50
R2 distribution and liver biopsy histology Mild Fibrosis LIC = 1.1 mg/g DW R2 = 30.9 ± 7.4 Cirrhosis LIC = 1.8 mg/g DW R2 = 29.9 ± 13.4
Relationship between LIC and total body iron stores in hereditary hemochromatosis
Serum ferritin and body iron stores in hereditary hemochromatosis Olynyk et al (1998) Am. J. Gastroenterol. 93, 346
Thalassemia Angelucci et al (2000) N Eng J Med 343, 327 LIC by biopsy vs total body iron stores by quantitative venesection Hereditary Hemochromatosis Summers et al (1990) Hepatology 12, 20 Olynyk et al (1998) Am. J. Gastroenterol. 93, 346
Body iron store distribution Extrahepatic iron store Liver iron store Liver volume V Total body iron store = liver iron store + extrahepatic iron store Liver iron store = liver iron concentration x liver volume
Measuring total body iron stores (TBIS) and liver iron stores • Measure LIC 3 times during venesection • Measure liver volume • Weighted fit through data • Extrapolate LIC to zero to obtain TBIS • Extrapolate LIC to 1 mg Fe/g dw for comparison of TBIS with other studies
Subjects & methods • Newly diagnosed hereditary hemochromatosis subjects were recruited (n=19) (male = 12, female = 7) • 17 C282Y homozygotes, 1 C282Y/H63D, 1 Wild-type/H63D • LIC measured with R2-MRI [6] • Liver volume measured with MRI simultaneously • Subjects recalled for follow-up LIC measurements at estimated half way point in venesection schedule and near end of schedule
Non-invasive monitoring of LIC during venesection Subject 1 Subject 2 Subject 3 Subject 4 LIC measured using R2-MRI. Dashed line is upper limit normal Subject 5 Subject 6 Subject 7 Solid lines are weighted fits to the data yielding estimate for initial LIC and total body iron store (from mL of blood to reach zero LIC).
R2-MRI Measurements 1.09 1.09 1.65 Gradients LIC vs TBIS by quantitative venesection in HH Biopsy Measurements Summers et al (1990) Hepatology 12, 20 Olynyk et al (1998) Am. J. Gastroenterol. 93, 346
R2-MRI Measurements (hereditary hemochromatosis) LIC vs TBIS by quantitative venesection Biopsy Measurements (thalassemia) Angelucci et al (2000) N Eng J Med 343, 327
7.3 10.6 Gradient LIC vs TBIS by quantitative venesection Biopsy Measurements (thalassemia) R2-MRI Measurements (hereditary hemochromatosis) Angelucci et al (2000) N Eng J Med 343, 327
Body iron store distribution Extrahepatic iron store Liver iron store Liver volume V Total body iron store = liver iron store + extrahepatic iron store Liver iron store = liver iron concentration x liver volume
ais fraction of total body iron store in the liver Extrahepatic iron store Liver iron store Liver volume V Total body iron store = liver iron store / a
Fraction (a) of iron store in liver • Mean fraction of iron stores in liver is 45% • Range 26 - 80%
0 Gradient = LIC / Age New model for iron distribution in HH • Assume fraction, , of total body iron store in the liver varies linearly with rate of liver iron loading (LIC/Age)
New model for predicting iron stores in HH 95% limits of agreement New Model: ± 40% Using LIC: ± 72% Using Ftn: ± 102%
Summary (1) • R2 imaging …… • can be used to measure non-invasively liver iron concentrations (LIC) with known accuracy and precision • has good sensitivity and specificity for measurement of LIC at both low and high LIC ranges • has dynamic range of measurement from normal LIC to the very highest concentrations encountered in clinical practice • works on most 1.5 T MRI units • has health regulatory authority clearance for LIC measurement in USA (FDA), Europe (CE Mark), and Australia (TGA) • may have the potential to detect liver cirrhosis/fibrosis
Summary (2) • Non-invasive measurement of LIC …… • Enables serial monitoring of patients on blood transfusion and chelation therapy to aid in chelation dose determination • Aids in the identification of newly diagnosed hemochromatosis patients who are at risk of iron induced liver damage
Summary (3) • Non-invasive measurement of LIC and liver volume… • Has demonstrated a correlation between fraction of TBIS in the liver and rate of iron loading in HH • Enables a more accurate prediction of venesection requirements for HH subjects compared with LIC or serum ferritin measurements
Co-workers • School of Physics, University of Western Australia • Paul Clark • Wanida Chua-anusorn • Adam Fleming • School of Medicine, University of Western Australia • Gary Jeffrey • John Olynyk • Ric Rossi • Thalassemia Research Center, Mahidol University • Pensri Pootrakul • Department of Haematology, Prince of Wales Hospital • Rob Lindeman • SKG Radiology • Erin Robins