Download
1 / 1
10 likes | 186 Vues
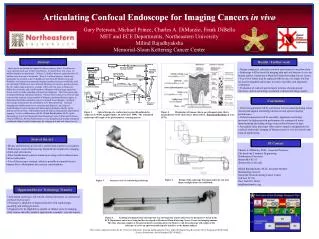
(A). (B). (A). (002) graphite. (B). (A). [011] Er 2 O 3. (B). (A). B. CNT (002). 2 nm. 20 nm. CNT d 002 =0.34 nm. (c). (d) ). Nanobiotechnology:Biosystems at Nanoscale. (C). (D). ZnS (110). Y 2 O 3 , d 002 =0.304 nm. Y 2 O 3 , d 002 =0.304 nm. (B).

E N D
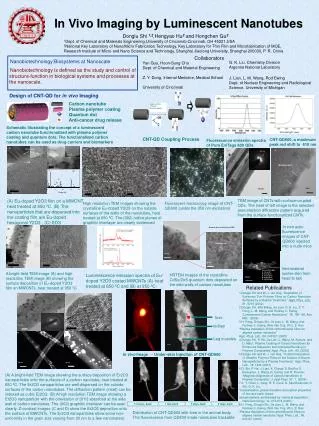
(A) (B) (A) (002) graphite (B) (A) [011] Er2O3 (B) (A) B CNT (002) 2 nm 20 nm CNT d002=0.34 nm (c) (d)) Nanobiotechnology:Biosystems at Nanoscale (C) (D) ZnS (110) Y2O3, d002=0.304 nm Y2O3, d002=0.304 nm (B) Nanobiotechnology is defined as the study and control of structure-function in biological systems and processes at the nanoscale. CNT d002=0.34 nm A Y2O3, d002=0.304 nm Y2O3 [011] C D Quantum dots E 5 mm 2 nm 2 nm 100 nm 2 nm A 0.01 ml CNTs-QDs A: 0.5 mg/ml B: 0.25 mg/ml C: 0.125 mg/ml D: 0.083 mg/ml E: 0.0625 mg/ml 1 nm 100 nm 40 nm 50 nm 10 cm Quantum dots on the lattice of CNTs 5 nm 50 nm Quantum dots (C) Y 15 cm Y Cu O Eu Eu Cu Y 10 nm Super-acid & Plasma functionalized 0 5 10 15 20 Energy (kV) 5 nm In Vivo Imaging by Luminescent Nanotubes Donglu Shi 1,2, Hengyao Hu2 and Hongchen Gu2 1Dept. of Chemical and Materials Engineering,University of Cincinnati,Cincinnati, OH 45221,USA 2National Key Laboratory of Nano/Micro Fabrication Technology, Key Laboratory for Thin Film and Microfabrication of MOE, Research Institute of Micro and Nano Science and Technology, Shanghai Jiaotong University, Shanghai 200030, P. R. China Collaborators G. K. Liu. Chemistry Division Argonne National Laboratory Yan Guo, Hoon-Sung Cho Dept. of Chemical and Material Engineering Z. Y. Dong, Internal Medicine, Medical School University of Cincinnati J. Lian, L. M. Wang, Rod Ewing Dept. of Nuclear Engineering and Radiological Science, University of Michigan Design of CNT-QD for in vivo Imaging Carbon nanotube Plasma polymer coating Quantum dot Anti-cancer drug release Schematic illustrating the concept of a luminescent carbon nanotube functionalized with plasma polymer coating and quantum dots. The functionalized carbon nanotubes can be used as drug carriers and biomarkers CNT-QD Coupling Process CNT-QD600, a maximum peak red shift to 610 nm Fluorescence emission spectra of Pure EviTags 600 QDs (A) Eu-doped Y2O3 film on a MWCNT, heat treated at 650 ºC. (B) The nanoparticles that are dispersed into the coating film are Eu-doped hexagonal Y2O3 , (C) EDS TEM image of CNTs with surface-coupled QDs. The inset of left image is the selected area electron diffraction pattern acquired from the surface-functionalized CNTs. High resolution TEM images showing the crystalline Eu-doped Y2O3 on the outside surfaces of the walls of the nanotubes, heat treated at 650 ºC. The (002) lattice planes of graphitic interlayer are clearly evidenced Fluorescent microscopy image of CNT-QD600 (under the 350 nm excitation) In vivo auto-fluorescence images of CNT-QD600 injected into a nude mice Ventrolateral (under-skin from head to tail) A bright-field TEM image (A) and high resolution TEM image (B) showing the surface deposition of Eu-doped Y2O3 film on MWCNTs, heat treated at 950 ºC Luminescence emission spectra of Eu-doped Y2O3 coated MWCNTs (A) heat treated at 650 ºC and (B) at 950 ºC. HRTEM images of the crystalline CdSe/ZnS quantum dots deposited on the side walls of carbon nanotubes Related Publications 1.Donglu Shi and W. J. van Ooij, “Deposition of Extremely Thin Polymer Films on Carbon Nanotube Surfaces by a Plasma Treatment,” Appl. Phys. Lett., 81, 5216 (2002) 2.Donglu Shi, Wei Wang, Jie Lian, G. K. Liu, Z. Y. Dong, L. M. Wang, and Rodney C. Ewing, “Luminescent Carbon Nanotubes”, 18, 189-193, Adv. Mat. (2006) 3.H. Peng, Donglu Shi, Jie Lian, L. M. Wang, and Rodney C. Ewing, Wim Van Ooij, W Li, Z. Ren “Plasma deposition of thin carbonfluorine films on aligned carbon nanotube,” Appl. Phys. Lett., 86, 043107 (2005) 4.Donglu Shi, P. He, Jie Lian, L. Wang, M. Schultz, and D. Mast, “Plasma Coating of Carbon Nanofibers for Enhanced Dispersion and Interfacial Bonding in Polymer Composites”,Appl. Phys. Lett., 83, (2003) 5.Donglu Shi and W. J. van Ooij, “Uniform Deposition of Ultrathin Polymer Films on the Surface of Alumin Nanoparticles by a Plasma Treatment,” Appl. Phys. Lett., 78, 1234 (2001) 6.D. Shi, P. He, J. Lian, X. Chaud, S, Bud’ko, E. Beaugnon, L. Wang, R. Ewing, and R. Tournier, “Magnetic Alignment of Carbon Nanofibers in Polymer Composite,” J. Appl Phys. 97. 1. (2005) 7.X. Y. Chen, L. Yang, R. E. Cook, S. Skanthakumar, D. Shi, G. K. Liu, “Crystallization, phase transition and optical properties of the rare-earth-doped nanophosphors synthesized by chemical deposition,” NanoTechnology, 14, 670-674 (2003) 8.H. Peng, Donglu Shi, Jie Lian, L. M. Wang, and Rodney C. Ewing, Wim Van Ooij, W Li, Z. Ren “Plasma deposition of thin carbonfluorine films on aligned carbon nanotube,”Appl. Phys. Lett., 86, 043107 (2005) liver kidney Leg muscles In vivo Image --- Under-skin Injection of CNT-QD680 (A) A bright-field TEM image showing the surface deposition of Er2O3 nanoparticles onto the surfaces of a carbon nanotube, heat treated at 650 ºC. The Er2O3 nanoparticles are well-dispersed on the outside surfaces of the carbon nanotubes. The diffraction pattern (inset) can be indexed as cubic Er2O3. (B) A high resolution TEM image showing a Er2O3 nanoparticle with the orientation of [011] absorbed at the side wall of carbon nanotubes. The (002) graphitic interlayer can be seen clearly. Z-contrast images (C and D) show the Er2O3 deposition onto the surface of MWCNTs. The Er2O3 nanoparticles show some non-uniformity in the grain size varying from 30 nm to a few nanometers. Distribution of CNT-QD800 with time in the animal body The fluorescence from QD800 made nanotubes trackable