Basic Study on Neph-analysis
Basic Study on Neph-analysis. Metosat-5. 74 E, 83.5 E 93.5 E. INSAT-3A & Kalpana-1 (2003) (2002). Location : INSAT 3A : 93.5ºE Kalpana-1 : 74ºE. Payload : (i) VHRR & CCD camera in INSAT 3A (ii) VHRR in Kalpana-1. VHRR Bands (µm) Visible : 0.55 – 0.75


Basic Study on Neph-analysis
E N D
Presentation Transcript
Metosat-5 74E, 83.5E 93.5E
INSAT-3A & Kalpana-1 (2003) (2002) Location : INSAT 3A : 93.5ºE Kalpana-1 : 74ºE Payload : (i) VHRR & CCD camera in INSAT 3A (ii) VHRR in Kalpana-1 • VHRR Bands (µm) • Visible : 0.55 – 0.75 • Water vapour : 5.70 – 7.10 • Thermal Infra Red : 10.5 – 12.5 • Resolution (km) : 2 X 2 for Visible • 8 X 8 for WV & TIR • CCD Camera Bands (µm) • Visible : 0.62 – 0.68 • Near Infra Red : 0.77 – 0.86 • Short Wave Infra Red : 1.55 – 1.69 • Resolution (km) : 1 X 1 for all bands
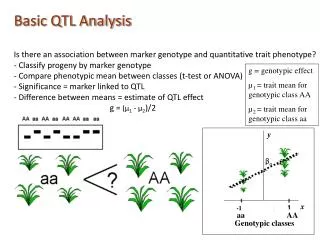
INSAT-3D : CHARACTERISTICS OF 6 CHANNEL IMAGER
INSAT-3D Sounder Channels Characteristics Detector Ch. No. c (m) c (cm-1) NET @300K Principal absorbing gas Purpose Long wave 1 14.67 682 0.17 CO2 Stratosphere temperature 2 14.32 699 0.16 CO2 Tropopause temperature 3 14.04 712 0.15 CO2 Upper-level temperature 4 13.64 733 0.12 CO2 Mid-level temperature 5 13.32 751 0.12 CO2 Low-level temperature 6 12.62 793 0.07 water vapor Total precipitable water 7 11.99 834 0.05 water vapor Surface temp., moisture 8 11.04 906 0.05 window Surface temperature 9 9.72 1029 0.10 ozone Total ozone 10 7.44 1344 0.05 water vapor Low-level moisture 11 7.03 1422 0.05 water vapor Mid-level moisture 12 6.53 1531 0.10 water vapor Upper-level moisture 13 4.58 2184 0.05 N2O Low-level temperature 14 4.53 2209 0.05 N2O Mid-level temperature 15 4.46 2241 0.05 CO2 Upper-level temperature 16 4.13 2420 0.05 CO2 Boundary-level temp. 17 3.98 2510 0.05 window Surface temperature 18 3.76 2658 0.05 window Surface temp., moisture 19 0.695 14367 - visible Cloud
Commonly Used Operational Images • VIS imagery derived from reflected sunlight at visible and NIR wavelengths (0.4 – 1.1 µm); • IR - Imagery derived from emissions by the Earth and its atmosphere at TIR wavelengths (10 – 12 µm); • WV - Imagery derived from watervapour emissions (6 – 7 µm); • 3.7 µm (often referred to as ‘Channel 3’)
INSAT-3A Vis Imagery • Highest spatial resolution • Water appears uniformly dark, due to the low albedo below 10% • Reflection intensities differ depending upon cloud thickness. • Land, cloud and ocean are easily discernible • Lower clouds can be seen well • Limitation: Only available from the sunlit portion of the earth 23 March 2004 1130 IST
What implies the different cloud albedo? • Clouds with a high albedo have:Large optical depthHigh cloud-water (ice) content Small average cloud droplet size • Clouds with a low albedo have:Shallow depth,Low cloud -water (ice) content Large average cloud-droplet size
Optical Depth • Optical depth is a measure of transparency • The optical depth expresses the quantity of light removed from a beam by scattering or absorption during its path through a medium. If I0 is the intensity of radiation at the source and I is the observed intensity after a given path, then optical depth is defined by the following equation: I/ I0 = e-
TYPICAL ALBEDO VALUES • OCEAN / LAKES 8 % • LAND SURFACE 14 - 27 % • ICE 35 % • SNOW 80 % • CU CLOUD 30 % • CI CLOUD (THICK) 35 % • ST CLOUD 50 - 60 % • AC , AS & SC CLOUDS 68 % • TCU CLOUD 75 % • CB CLOUD 90 %
Interpretation of VISIBLE Imagery The brightness of clouds in VIS image depends on · Solar elevation and the sensor viewing angle · Reflectivity of clouds · Resolution of the radiometer system
Solar Elevation and Sensor Viewing Angle • These are mainly geographical factors which lead to clouds appearing brighter when looking at them towards the sun than away from it. • Clouds are brighter with high sun angle than when solar elevation is low. • Decreasing solar elevation will result in reduction in the level of illumination and a corresponding reduction in the brightness of cloud response will occur across the image in the direction of decreasing sun angle. • However at low sun angles the sides of deep convective clouds or thick cloud layers can still produce quite bright responses leading to highlights appearing within at the relatively darker portions of the image
Reflectivity • Brightness of a cloud will depend upon its reflectivity. This is largely determined by its thickness, composition (ice or liquid water) and the particle size distribution. • Clouds have higher albedo than land (apart from snow cover) & hence appear white or light grey. • Clouds with high albedo have larger depth , high cloud water (ice) content & small cloud droplet size. • Clouds with low albedo have shallow depth due to low cloud water (ice) content & large average cloud droplet size.
Reflectivity • In general the thicker the cloud the brighter the response and for the same thickness and illumination liquid water clouds will appear brighter than ice clouds. • VIS image is useful for distinguishing between sea, land & clouds. Seas/lakes have low albedo and hence appear dark. Land appears brighter but darker than clouds • Desert appears very bright in contrast to the darkness of forests & vegetation. • Texture of the cloud in VIS image can help identification of different types of clouds.
Problem Areas in Interpreting VIS Imagery • Distinguishing Clouds from Snow-covered Ground • Surface Geography is essential • Show a quasi-permanent ‘Dendritic’ pattern • Unfrozen lakes, rivers and fjords stand out as dark features • Animation of images can reveal clouds • Small Clouds • The radiation reaching a satellite is partly from the clouds and partly from the Earth’s surface. • If the clouds are smaller than the resolution of the satellite radiometer, the imagery will have a uniform character quite unlike a normal view of convective clouds. • Over a dark sea surface, the presence of small Cu produces a rather lighter, greyer area on the VIS image • Thin clouds • Do not show up very brightly in VIS imagery, leads to underestimation. • May also allow scattered light from lower clouds, or from the Earth’s surface • Thus, thin cloud over a high-albedo may look misleadingly bright
INSAT-3A IR Imagery (window region) 23 March 2004 1130 IST • In this spectral band, atmosphere is relatively transparent to radiation upwelling from earth • Again, clouds, land and water are easily discerned • The satellite detector receives the thermal rad-iation of the earth's surface and of the upper sides of clouds • Due to the low temperature, Cirrus clouds are better visible in the infrared images • They provide image at night • Inverted images
Problem Areas in Interpreting IR Imagery • The conversion from an emitted radiance to a temperature assumes that a cloud behaves as a black body, but this is only strictly true for low clouds thicker than a few hundred meters or for very thick upper clouds. • With thin clouds or small clouds which do not fill the field of view, radiation from the underlying surface can reach the satellite. The clouds then appear warmer than they really are, and will be assigned a height which is too low. • Corrections must be applied for absorption or emission by atmospheric watervapour otherwise the measured temperature will be less than the true temperature. The error will be largest where the water vapour content is highest in warm, low-level air at low latitudes. It is also large near the edges or ‘limbs’ of an image, where the radiation is coming obliquely to the satellite. The combined error in mid-latitudes can be 2-3°C, but may be 10°C in the tropics. • The ‘surface temperature’ estimated from the satellite IR radiance is the temperature of the earth’s skin, and usually differs from the ‘surface air temperature’ of synoptic meteorology by several degrees.
WV image 05UTC 17 Nov 1999 GMS • Always available • Shades of levels differ depending upon humidity in upper to midlevel (WV). • Upper clouds can be seen well. • Levels may vary depending upon absorption by clouds and atmosphere on the way.
Interpretation of WV Imagery • In a normally moist atmosphere, most of the WV radiation received by the satellite originates in the 300 - 600 hPa layer • When the air is dry some radiation may come from layers as low as 800 hPa. • Due to the general pole ward decrease of water vapour content, the height of the contributing layer gets lower towards the poles. • It is particularly important to note that even when a WV image indicates a very dry upper troposphere, there may well be moist air near the surface. Moist air or cloud in the lower half of the troposphere is not depicted well in WV imagery. Since clouds do emit radiation in this waveband high clouds may be seen. In particular thick high clouds, such as cumulonimbus (Cb) anvils, stand out prominently in both WV and IR images
Approximate Levels from which Radiation in the WV Channel reaches a Satellite The dashed arrows span the levels from which some significant radiation may reach the satellite. The thick lines indicate the levels of maximum contribution
CLOUD MATRIX I N F R A R E D DEEP CONV CB / TCU WHITE (COLD) DARK (WARM) THIN CIRRUS LOW CLOUDS NO CLOUDS DARK WHITE VISIBLE
Clouds Visible Inferred Fair Wx Too small to be resolve. Their presence causes Nearly detectable since Cu land or water to appear slightly brighter. the temperature is very close to that of earth. Cu/C u Appear as cloud field made up of groups of A large temperature C ongestis irregularly shape elements of varying size; difference; irregular arranged into lines, cellular patterns, uneven patterns of alternating mottled appearance. light and dark patches. C b Very white cloud with uniform top. A sharp Bright white tone. Bright dist inct edge on one side; Ci - plume extending on patches with well defined the other side; fuzzy indistinct edge; C b will boundaries. CB with produce a large C i - shield, at low sun light, C b anvils has boundaries casts shadows on lower clouds. which are less sharp and their tone towards the edges is less bright. S c Tone white in the centre of the cloud formation Tone varies from light to light grey at the edges; generally globular 20 - grey to dark grey. If 1 00 km in diameter. Often they have pebbly or gaps are small, they honeycomb structure depen ding on the size of appear as continuous their gaps. grey. Difficult to detect S c when the temperature deference is small
Interpretation of Satellite Cloud imagery • Cloud configuration in satellite imagery is a combination of all types of atmospheric processes. • Make use of both the information from satellite imagery as well as other observational data • Satellite sees top of clouds (view from the top) whereas other conventional observations pertains to the lower layers of the atmosphere (view from the ground)
CHARACTERISTIC FEATURES • BRIGHTNESS ( WHITE, GREY ) • PATTERN ( LINE, BANDS, WAVES) • STRUCTURE ( SHADOW, HIGHLIGHT ) • TEXTURE ( SMOOTHNESS ) • SHAPE ( ROUND, STRAIGHT ) • SIZE ( Useful indicators of Weather System)
Characteristic features of clouds useful for their interpretation • Brightness • The most fundamental feature is the brightness of cloud response which depends on the albedo of the underlying surface in VIS imagery whereas in the IR it is a measure of temperature • In VIS image clouds normally contrast well against cloud free surface but less so between themselves. In IR cloud/ground and cloud/cloud contrast is determined by temperature differences between various radiating surfaces.
Characteristic features of clouds useful for their interpretation • Pattern • Cloud elements are seen to be organized into identifiable patterns such as lines, bands, waves etc. • Structure • Shadows and highlights are the characteristic features of VIS image which give a 3-D appearance that is completely lacking in IR imagery. • In VIS imagery a sense of cloud structure can often be gained from a 3-D appearance generated by cloud shadows and highlights. • In IR cloud top temperature serves as a direct measurement
Infrared image of cloud band and cloud line at 00UTC, April 20, 1999. Visible image of cloud band and cloud line at 00UTC, April 20, 1999.
Texture • This is the degree of apparent smoothness displayed by the upper surfaces of clouds in the VIS image. • Clouds in satellite images vary in degree of apparent smoothness, some appear smooth while others may look ragged.
CHARACTERISTIC FEATURES OF CLOUDS USEFUL FOR THEIR INTERPRETATION • Shape • Clouds assume variety of shapes - rounded, straight, serrated, scalloped, diffused or curved. • Size • The size of the pattern and size of the individual elements in a pattern are useful indicators for assessing the scales of weather systems
BASIC RULES TO BE REMEMBERED FOR INTERPRETATION OF SATELLITE IMAGERIES • Continuity in time has to be maintained. Images should not be viewed in isolation but interpreted with reference to past images. • It is necessary to keep in mind the time of the day, season and local peculiarities • In VIS image illumination depends on the position of the sun which will vary brightness of clouds. • Local features like mountains/valleys introduce their own effects. Tibetan Plateau will be cold at night and hence bright whereas tropical oceans would maintain same type of shades throughout the diurnal cycle.
Interpretation of IR imagery • The degree of whiteness displayed in IR imagery is a measure of temperature, which in the case of clouds, can be considered to be that of the uppermost cloud surface (cloud top) within the field of view • IR image indicates temperature of the radiating surfaces : warm areas being dark & cold areas in lighter shades. • Clouds will generally appear whiter than the earth's surface because of their lower temperature. In this respect VIS & IR images have some similarity.
Interpretation of IR imagery • Cloud top temperatures decrease with height. IR image show good contrast between clouds at different levels, which is not possible in VIS • Although thick cloud layers can be considered opaque to radiation from underlying surface, thin layers are not so. The apparent temperature of these thin clouds will appear somewhat higher than their true values & they will appear to be warmer and therefore at a lower level than actually the case (eg. Thin cirrus over the tropics)
Interpretation of IR imagery • Low stratus/fog will have temperatures little different from adjacent cloud free areas. though they would show up somewhat white in VIS imagery, it is difficult to identify them in IR image. In other words, a cloud formation that is identifiable in VIS image but produces a minimal or no recognizable response in IR image must inevitably be shallow surface (or close to) feature. • It is impossible to determine that an area is free of low cloud/fog on the basis of IR image alone during nights
Interpretation of IR imagery • IR image is quite useful for cloud recognition in lower levels over desert areas • IR images are inferior to VIS in providing information about cloud texture as it is based on emitted and not scattered radiation • Brightness difference in VIS represent differences in reflectivity whereas in IR imagery it represents temperature differences of the emitting surface • Surface temperature in IR is the temperature of the earth’s skin and usually differs from the surface air temperature by a few degrees.
Interpretation of WV imagery • Information derived from radiation at wavelength 6-7 μm. In this part of the spectrum water vapour is the dominant absorbing gas (strong absorption band centered near 6.7 μm) • Regions of high humidity appear bright and regions of low humidity relatively darker • Most of the WV radiation received by the satellite originates in the 300-600 hPa layers. When air is dry, radiation may come from 800 hPa layer also. • Due to general pole-ward decrease of WV content, the height of the contributing layer gets lower & lower towards poles • Since clouds emit radiation in this wave band, high clouds can also be seen in this imagery
Interpretation of WV imagery • Broad scale flow patterns are particularly striking in WV Imagery as WV acts as passive tracers of atmospheric motions. WV imagery is therefore useful for displaying mid-trop flow (mid-lat cyclones) which are clearly defined by moist spirals (comma shaped patterns) • Subsidence area may appear dark • Jet streams are delineated by sharp gradients in moisture with dry air on pole ward side. • Moisture or clouds in lower layers of the atmosphere are not depicted well in WV imagery.
“Channel 3” imagery • This channel is situated in the small overlap region between VIS & IR wavelengths (3.7μm) • During night there is no solar contribution and the radiation in this channel originates from terrestrial source as in IR. During day, there is a mixture of solar & terrestrial radiation with predominant role of the solar component. • Identification of fog/low cloud during night is done better than IR imagery