Download
1 / 51
510 likes | 620 Vues
Discover how the Central Limit Theorem aids in analyzing sample means within intervals, constructing sampling distributions, and determining mean and standard deviation relationships. Learn through practical examples and histograms.

E N D
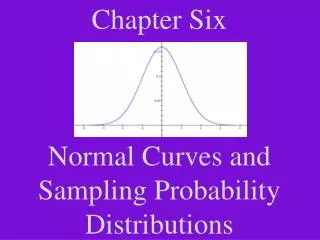
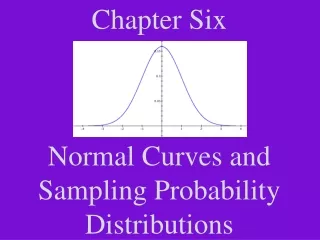
Chapter SixNormal Curves and Sampling Probability Distributions
or invert and multiply to get the formula you are to use in this class:
To find the probability that a sample mean is within a given interval:
Constructing a Sampling Distribution of the Mean for Samples of Size n = 2 List all samples and compute the mean of each sample. sample: mean: sample: mean {1,1} 1.0 {1,6} 3.5 {1,2} 1.5 {2,1} 1.5 {1,3} 2.0 {2,2} 2.0 {1,4} 2.5 … ... {1,5} 3.0 How many different samples are there? 36
Sampling Distribution of the Mean p 1.0 1/36 1.5 2/36 2.0 3/36 2.5 4/36 3.0 5/36 3.5 6/36 4.0 5/36 4.5 4/36 5.0 3/36 5.5 2/36 6.0 1/36
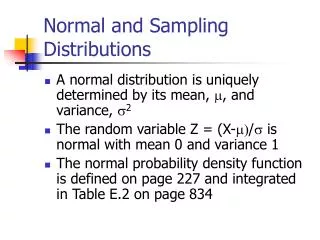
We can use this theorem to draw conclusions about means of samples taken from normal distributions.If the original distribution is normal, then the sampling distribution will be normal.
The mean of the sampling distribution is equal to the mean of the original distribution.
The standard deviation of the sampling distribution is equal to the standard deviation of the original distribution divided by the square root of the sample size.
-0.33 0.17
-1.00 0.50
-2.67 1.33
-3.33 1.67
-4.00 2.00