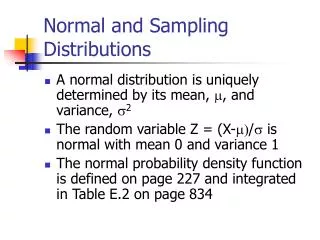
Understanding Z-Scores and Areas Under the Standard Normal Distribution
This chapter discusses the concept of z-scores, which represent the number of standard deviations a data point is from the mean in a normal distribution. It introduces the calculation of z-scores using examples related to pizza delivery times, illustrating how to interpret these scores. The section further explains the importance of the standard normal distribution and provides methods for calculating areas under the normal curve, utilizing the Normal Probability Table. Various applications highlight how to determine probabilities based on z-scores, enhancing comprehension of statistical analysis.

Understanding Z-Scores and Areas Under the Standard Normal Distribution
E N D
Presentation Transcript
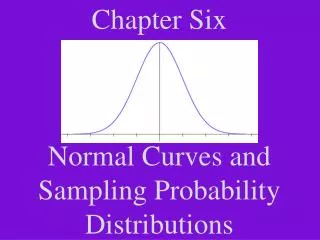
Chapter SixNormal Curves and Sampling Probability Distributions
Chapter 6 Section 2 Standard Units and Areas Under the Standard Normal Distribution
Z Score • The z value or z score tells the number of standard deviations the original measurement is from the mean. • The z value is in standard units.
Calculating z-scores The amount of time it takes for a pizza delivery is approximately normally distributed with a mean of 25 minutes and a standard deviation of 2 minutes. Convert 21 minutes to a z-score.
Calculating z-scores Mean delivery time = 25 minutes Standard deviation = 2 minutes Convert 29.7 minutes to a z score.
Interpreting z-scores Mean delivery time = 25 minutes Standard deviation = 2 minutes Interpret a z score of 1.6. The delivery time is 28.2 minutes.
Standard Normal Distribution: μ = 0 σ = 1 Values are converted to z scores where
Importance of the Standard Normal Distribution: Standard Normal Distribution: 1 0 Any Normal Distribution: The areas are equal. μ 1σ
Use of the Normal Probability Table (Table 4) - Appendix I Entries give the probability that a standard normally distributed random variable will assume a value between the mean (zero) and a given z-score.
Patterns for Finding Areas Under the Standard Normal Curve To find the area between a given z value and zero: Use Table 4 (Appendix I) directly. z 0
Patterns for Finding Areas Under the Standard Normal Curve To find the area between z values on either side of zero: Add area from z1 to zero toarea from zero to z2 . z1 z2 0
Patterns for Finding Areas Under the Standard Normal Curve To find the area between z values on the same side of zero: Subtract area from zero to z1 from the area from zero to z2. z1 z2 0
Patterns for Finding Areas Under the Standard Normal Curve To find the area to the right of a positive z value or to the left of a negative z value: Subtract the area from zero to z from 0.5000 . 0.5000 z 0
Patterns for Finding Areas Under the Standard Normal Curve To find the area to the left of a positive z value or to the right of a negative z value: Add 0.5000 to the area from zero to z . 0.5000 table z 0
Use of the Normal Probability Table a. P(0 < z < 1.24) = _________________ b. P(0 < z < 1.60) = _________________ c. P( - 2.37 < z < 0) = ________________ 0.3925 0.4452 0.4911
Normal Probability 0.9974 d. P( - 3 < z < 3 ) = ____________________ e. P( - 2.34 < z < 1.57 ) = ______________ f. P( 1.24 < z < 1.88 ) = ________________ g. P(-3.52<z< -0.98) = __________________ 0.9322 0.0774 0.1633
Normal Probability 0.9495 h. P(z < 1.64) = _________________ i. P(z > 2.39) = __________________ j. P(z > -1.35) = _________________ k. P(z < -0.64) = _________________ 0.0084 0.9115 0.2611
Application of theNormal Curve The amount of time it takes for a pizza delivery is approximately normally distributed with a mean of 25 minutes and a standard deviation of 2 minutes. If you order a pizza, find the probability that the delivery time will be:a. between 25 and 27 minutes. a. ____________ b. less than 30 minutes. b. ____________ c. less than 22.7 minutes. c. ____________ 0.3413 0.9938 0.1251
Application of theNormal Curve The amount of time it takes for a pizza delivery is approximately normally distributed with a mean of 25 minutes and a standard deviation of 2 minutes. If you order a pizza, find the probability that the delivery time will be:a. between 25 and 27 minutes. 0.3413 0 1
Application of theNormal Curve The amount of time it takes for a pizza delivery is approximately normally distributed with a mean of 25 minutes and a standard deviation of 2 minutes. If you order a pizza, find the probability that the delivery time will be:b. less than 30 minutes. 0.9938 2.5
Application of theNormal Curve The amount of time it takes for a pizza delivery is approximately normally distributed with a mean of 25 minutes and a standard deviation of 2 minutes. If you order a pizza, find the probability that the delivery time will be: c. less than 22.7 minutes. 0.1251 -1.15
Homework Assignments Chapter 6 Section 2 Pages 274 - 276 Exercises: 1 - 49, odd Exercises: 2 - 50, even