
Investigating Top 20 Genes in Rice Array Experiment Using R Annotation Tools
This assignment involves utilizing R annotation tools to analyze the top 20 genes from the Rice array experiment. You will submit a gene list to David and explore the findings. Investigate gene-specific p-values (p < 0.05), posterior p-values (p < 0.05), and posterior FDR p-values (FDR < 0.20). Determine any qualitative differences and quantify the number of genes in each category. Furthermore, learn to compute the overlap among these gene categories for a comprehensive understanding of the results.

Investigating Top 20 Genes in Rice Array Experiment Using R Annotation Tools
E N D
Presentation Transcript
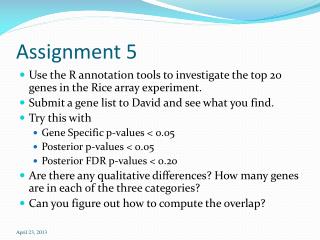
Assignment 5 • Use the R annotation tools to investigate the top 20 genes in the Rice array experiment. • Submit a gene list to David and see what you find. • Try this with • Gene Specific p-values < 0.05 • Posterior p-values < 0.05 • Posterior FDR p-values < 0.20 • Are there any qualitative differences? How many genes are in each of the three categories? • Can you figure out how to compute the overlap?
> library(affy) > rrdata<- ReadAffy() > eset <- rma(rrdata) > group <- factor(c(0,0,1,1,2,2,3,3,4,4,5,5)) > vlist <- list(group=group) > eset.lmg <- neweS(exprs(eset),vlist) > lmg.results <- LMGene(eset.lmg) > pv1 <- genediff(eset.lmg) > names(pv1) [1] "Gene.Specific" "Posterior" > pv2 <- pvadjust(genediff.results) > names(pv2) [1] "Gene.Specific" "Posterior" "Gene.Specific.FDR" [4] "Posterior.FDR" > sum(pv2$Gene.Specific < .05) [1] 2615 > sum(pv2$Posterior < .05) [1] 3082 > sum(pv2$Posterior.FDR < .20) [1] 3360 SPH 247 Statistical Analysis of Laboratory Data
> list1 <- pv1$Gene.Specific < .05 > list2 <- pv1$Posterior < .05 > list3 <- pv2$Posterior.FDR < .20 > gene.background<- featureNames(eset) > sig.genes1 <- gene.background[list1] > sig.genes2 <- gene.background[list2] > sig.genes3 <- gene.background[list3] > write(sig.genes1,"sig.genes1.txt") > write(sig.genes2,"sig.genes2.txt") > write(sig.genes3,"sig.genes3.txt") > write(gene.background,"gene.background.txt") > table(list1,list2,list3) , , list3 = FALSE list2 list1 FALSE TRUE FALSE 8960 0 TRUE 305 0 , , list3 = TRUE list2 list1 FALSE TRUE FALSE 87 963 TRUE 16 2294[1] 1173
GS < .05 2615 Posterior < .05 3082 305 0 0 2294 16 963 87 Posterior FDR < .20 3360 SPH 247 Statistical Analysis of Laboratory Data