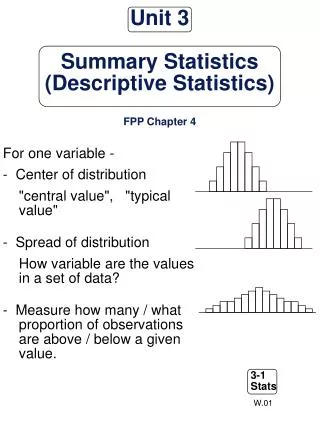
Statistics Unit
This guide aims to enhance your understanding of essential statistical concepts. Explore what the standard deviation represents for a sample versus a population, and learn how to interpret the σx in your calculator when doing one-variable statistics. Discover the meaning of z-values and what they indicate when referenced from a z-score chart. Additionally, understand the prerequisites for calculating z-scores and the reliability criteria for confidence intervals. This resource is vital for anyone looking to solidify their statistics knowledge.

Statistics Unit
E N D
Presentation Transcript
Statistics Unit Check your understanding…
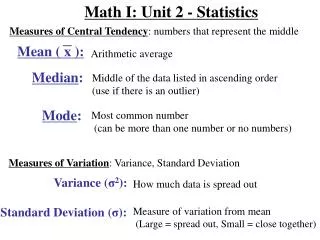
Can you answer these? • What does the standard deviation of a sample represent? • What is the difference between calculating the standard deviation of a sample or of a population? • If you enter a sample into the stats list of your calculator and do a 1 variable stats on it, what does the σx mean?
…and these? • What does a z value mean? • When you “look-up” a z-values on your z-score chart, what does this number mean? • What must you know about your data before finding a z-score? • What two things must be true before the results of a confidence interval calculation can be considered reliable?