Download

1 / 43
440 likes | 579 Vues
Physical Methods for Cultural Heritages Introduction to Reflectometry and Colorimetry G. Valentini - Tel. 6071 - gianluca.valentini@polimi.it. The electromagnetic spectrum. Light reflected by a surface. When light impinges onto a surface different effects take place: Specular reflection

E N D
Physical Methods for Cultural Heritages Introduction to Reflectometry and Colorimetry G. Valentini - Tel. 6071 - gianluca.valentini@polimi.it
Light reflected by a surface • When light impinges onto a surfacedifferent effects take place: • Specular reflection • Absorption K(l) • Scattering S(l) • Phenomena a) b) and c) determine the luminance and the colour of the surface • Diffuse Reflectance R(l) Diffuse reflectance(infinite medium) • The light that undergo specular reflection has the same feature of the lamp (it is NOT important) • Diffused light can be analyzed with a spectrophotometer • Wideband light source • Spectral selector(e.g. diffraction grating) • Photodetector
Spectrophotometry (1) • The spectrophotometer is put in contactwith the surface and measures the spectrum R(l) of the diffused reflected light • Spectrophotometers are “calibrated”with reference materials of known reflectance [R(l)1]
Multispectral Imaging and IR Reflectography • Images of paintings are taken through spectral filters • RGB Reflectography • Primary filters are used to record a colour image with a B&W detector • Better image quality in terms of spatial resolution and colour fidelity compared to colour cameras • Multiband Reflectography • Relies on a sequence of narrowband spectral filters and allows one to measure the spectrum of diffuse reflectance in every point of an image • False colour imaging • Formerly taken with the Ektachrome Pro Infrared EIR Kodak reversal film • Now made with a CCD camera with suitable filters • Green Blue Red Green Infrared Red • Reveals details not visible by the naked eye • IR Reflectography • Relies on CCD cameras with sensitivity up to 1mm (Si) or 1.7 mm (InGaAs) • Allows researchers and restorers to see the preparatory drawing
Multispectral Reflectography • Multispectral Reflectography relies on a tunable filter that selects a narrow spectral band between 400 and 700 nm • A sequence of images spanning the whole visible band is acquired • A reference sample (perfect white) is conveniently imaged as well • It can be also used to analyze the UV excited fluorescence emission • Image processing allows us: • To measure the chromatic features of the surface • To monitor the chromatic changes possibly caused by inappropriate environmental conditions (lighting, humidity, temperature, etc.) • Images can be processed using multivariate analysis (e.g. Principal Component Analysis - PCA) • Multivariate analysis seeks for independent information elements in order to reduce the size of the dataset 7
Infrared reflectography • IR Reflectography is made upon illuminating the painting with a halogen lamp • Formerly the images were taken with the HIE 135 Kodak film (sensitivity up to 900 nm) through the IR Wratten N°87 filter • Images are presently taken with a B/W CCD camera with an IR filter • Sensitivity up to 1.1 mm with silicon CCD cameras • Sensitivity in the range 900-1700 nm with InGaAs CCD cameras • Alternatively a high resolution multiband scanner can be used (Istituto Nazionale di Ottica - Florence) • The painted layer is partially transparent in the spectral band 0.8–2.0 mm • IR Reflectography allows one to observe the preparatory drawings • This is certainly true if the drawings are made with carbon or graphite that absorb infrared radiation • It is also possible to observe the “pentimenti” or to detect previous restorations (InGaAs) (Silicon)
IR Reflectography (application examples) Santo Vescovo Matteo by Giovanni di Pienza Painting on wood by Fra Bartolomeo Volterra Cathedral The Holy Family Niccolò di Bartolomeo Pisano
Light and colour • The spectrophotometric analysis of a surface provides the complete knowledge of the diffuse reflectance in the visible and near infrared bands • These information are very important to identify the pigments and to study the conservation status of the works of art • Spectrophotometric measurements requires complex instruments and might be redundant • Colour perception provides a “rough” spectrophotometric measurement of a surface • Colorimetry is the science of colour measurement • The basis of coulorimetry: • Coulorimetry relies on the physiology of the eye and on the laws of the geometrical optic • Colour measurement relies on the experience of “standard observers” free from any visual impairment • The characteristics of the standard observer has been standardized by a CIE committee in 1931 (thereafter updated several times)
Light and colour • Physical basis of the colour • Colour is caused by: • Selective absorption of the light emitted by a wide spectrum source • Interference • Fluorescence • Colour can be intentionally synthesized in different ways • Subtractive colour synthesis • Printing devices and visual arts • Additive colour synthesis • TV screen, video monitors and projectors Additive synthesis Subtractive synthesis
Historical review of the colour sciences • “Colour matching” phase • Originally proposed by James C. Maxwell (1860) • Led to the definition of psychophysical quantities • Based on “Colour Matching Functions” • “Colour difference” phase • Originally proposed by Helmoltz (1891) and Schrodinger (1920) • Led to the definition of psychometric quantities • Mainly deals with the “measurement” of the colours • “Colour Appearance” phase • Mainly deals with colour perception taking into account two antithetical experiences: • Permanence of the colour: the colour of an object perceived by an observer seems not to depend on the light source • Variance of the colour: the colour of an object seems to depend on the proximal field, on the background and on the illumination intensity 13
Eye physiology • The radiation field is characterized outside the eye in the spectral intervall = 360 nm – 760 nm • The light entering the eye is called Colour Stimulus and corresponds to the spectral radiance of the radiation field: • Refractive media of the eye (e.g. the lens) absorb the light according to age dependent spectral features • The macula lutea contains a pigment that modifies the spectral properties of the radiation field measurements with 4° or 10° aperture angle Otical density of the lens for a young subject Optical density of the pigment inside the macula lutea 14
Physiology of the retina • Inside the retina there exist two types of light receptors • Rods • Responsible for night vision(scotopic vision) • High sensitivity • High density in peripheral regionsof the retina • Cones • Responsible for daylight vision(photopic vision) • Less sensitive than rods • Are mainly located in the centralregion of the retina (fovea e nearbyareas) • Belong to three types that have different spectral features(short, medium e long wavelength)
Fundamental reference • Light absorption by cones triggers the colour vision process • Cones contains different photopigments that absorb at short, medium and long wavelengths (S, M, L) • Principle of Univariance (Rushton): • “The output of a receptor depends upon its quantum catch, but not upon what quanta are caught”: the visual stimulus depends on the photon absorption rate (activation of cones) but not on photon energy • The activationsof cones correspond to three numbers that completely describe the colour of the light (Tristimulus Principle) [Young Hypothesis] Discrimination threshold between monochromatic radiationsof equal intensity Optical desities of photopigments S, M, L 16
Spectral irradiance of a light source andthe Tristimulus Principle • The radiation field emitted by a lightsource is characterized by a powerspectral distribution as a function ofthe wavelenght l • The spectral overlap of different lightsources obeys the rules of linear algebra • If N sources [b1, b2,...bn] are summedone get: • If the characteristics of the N sources b are known, the “vector” a describes completely the system behaviour • It is a common experinece that by combining the light of 3 sources properly assembled one can reproduce any colour • The complete knowledge of the emission spectrum of a light source is redundant for colour perception Vector b
Psycophysical Colorimetry • For the vision with maximum acuity (macula 4°), according to the Standard Observer CIE 1931 (CIE = Commission Internationale de l'Eclairage) • The Activation of Cones are specified by three numbers that satisfy the Grassman Laws (1853) • Symmetry Law▪ Transitivity Law If A B → B A if A B e A B → A C • Proportionality Law If A B → aA aB • Additivity Law If A B, C D and (A+C) (B+D) → (A+D) (B+C) • The activations are represented by points of a linear space with 3 dimensions (Tristimulus Space) • Reference systems (Axes of the tristimulus space) • Fundamentalreference system (LMS) • Instrumentalreference system (RGB) • Standard CIE 1931 reference system (XYZ) • The Grassman laws hold only if: • The observation is made under a small angle • The eye has not been previously polarized • The observer is free from visual impairments 18
Fundamental reference system • The activations of cones produced by a colour stimulus of spectral radiance Le,l in the fundamental system are given by the tristimulus values L,M,S: • The functions takeinto accounts the light absorptionby the lens and the macula • The functions are normalized • Equal energy stimulus: • The functions are thecomponents of tristimulus vector ofmonochromatic lights (l) of unitary irradiance are the Colour-matching Functions 19
Q Fundamental tristimulus space • In tristimulus space the length of vector Q (L,M,S) gives the amplitude of the stimulus induced by a light • The intersection of vector Q with the plane L+M+S = 1 is given by a point that corresponds to the ChromaticityCoordinates of the light • Points of plane L+M+S = 1 constitute the Chromaticity Diagram • In chromaticity diagram the monochromatic lightsoutline the Spectrum Locus • The colour stimuli are represented by barycentriccoordinates Areas of triangles SMQ, LSQ e MLQ are proportional to the coordinates l,m,s Spectrum locus Acromatic colours Purple line 20
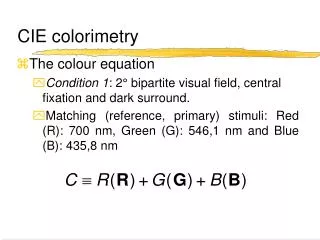
ba bt bm The R,G,B tristimulus space • Colour matching functions of R,G,B space can be directly measured through the metameric colour matching with a bipartite field • The test device shown in figure is presented to a standardobserver • The observer can change the intensity of 3 sourceswhose light is summed on hemicycle bm in order to makeit equal to hemicycle bt (colour matching) • The light sources used in this experiment are called Primary Sources P and the intensities of the 3 sources are the tristimulus values t of the test light • If the test light are monochromatic radiations one gets the Colour-matching Functions • Constants K’s are defined in such a way that equal values of the tristimulus corresponds to the radiation of uniform spectral power density • The tristimulus values and the chromaticity coordinates of a light Le,l are: 21
The Colour-matching Functions The colour-matching functions depends on the choice of the primary sources P In standard RGB space the primary light sourceshave wavelengths: and intensity ratios: The uniform spectral power density lighthas chromaticity: A linear transformation allows one toconvert the values of tristimulus (R,G,B)into (L,M,S) and vice versa Other linear transformations convertthe colour-matching functions and 72.1:1.4:1.0 22
The “spetctrum locus” • It is important to determine the chromaticity coordinates of a series of monochromatic light sources • Functions r(l), g(l) define a curve in chromaticity diagram called Spectrum Locus • The straight line that connect theends of spectrum locus is calledPurple Line • The area within the spectrum locus and the purple line containsall the possible colours • Point E represents the “colour”of a light source having equalpower density all over the visiblespectrum • The chromatic coordinates of a light source can be negatives !
Tristimulus space X,Y,Z of system CIE 1931 • The system CIE 1931 includes photometryinto colorimetry • The luminanceof a light source is defined by the equation: V(l) = relative photopic luminous efficiency (CIE 1924)Km = 683 lumen/watt • The luminance equation is equivalent to those that define the tristimulus → it would be possible to hypothesize the existence of a specific receptors • It has been preferred to assume that the luminance is produced by the activation of cones and can be obtained from a linear combination of tristimulus values: • The luminance of a colour stimulus resulting from the sum of colour stimuli is equal to the sum of the luminances (Abney Law) • The colour-matching functions definethe new space X,Y,Z • The definition of system X,Y,Z assumes that the Y component of the tristimulus is proportional to the luminance:
Properties of the colorimetric space X,Y,Z • Axes X,Y,Z are orthogonal and axes X e Z belong to the plane of null luminance • Planes X=0 e Z=0 are tangent to the spectrum locus • Tristimulus values and chromaticity coordinates are: • The Chromaticity Diagram is obtained by projecting from infinity onto plane Z=0 the diagram made on plane X+Y+Z=1 con Coordinates x,y,z are barycentric Comparison between CIE 1931 (4°) and CIE 1964 (10°) Spectrum locus Acromatic colours Purple line 25
Comparison between colorimetric spaces R,G,B and X,Y,Z • In colorimetric space R,G,B some light sources have negative chromaticy coordinates • In colorimetric space X,Y,Z the chromaticy coordinates are always positive • The primary light sources of the space X,Y,Z are imaginary sources RGB XYZ
Chromatic diagram CIE 1931 and gamut of a colour rendering device
Measurement of the colour of a surface • Any surface “reflect” and “diffuse” the light emitted by a source and modifies the spectral properties of the light • It is possible to measure the colour of a surface by estimating the tristimulus values and the chromaticy coordinates of the light reflected by the surface upon illumination with a standard illuminant • Examples of standardilluminants: • Illuminatnts that simulate the solar spectrum: D55, D65, D75 • Illuminatnt A simulates a halogen lamp • The arrangement of the light source and the detector must avoid any reflection • The tristimulus parameters of the reflectedlight are given by equations:
Colorimeters • Colorimeters are devices that measure the light reflected by a surface through 3 calibrated colour filters • They usually relies on a daylight D65 illuminant and provide the chromatic coordinates in selectable colour spaces (RGB, XYZ, L*a*b*, ...)
Psycometric colorimetryThe colorimetric space CIE Lab • In colorimetric spaces RGB and XYZ, the perception of colour differences does not correspond to the distanceof points in chromaticity diagram • Even referring to the perception of luminance the eye does NON show a linear behaviour but a logarithmic one • Weber Law: the ratio between the minimum differenceof luminance detectable and the luminance of the stimulus is constant • The colorimetric space CIE L*a*b* has been defined with the aim of being a (non linear) metric space in terms of perception • The equations that relate the coordinates in space L*a*b* and space X,Y,Z are non linear and really complex ! • The parameter L*defines the luminance of a surface • Parameters a* eb* represent the colour of a surface • The distance between chromaticity points of two light sources in space CIE L*a*b* is defined as: a* opponence red-green b* opponence yellow-blue
Colour appearance • Colour appearance deals with complex visual processes and colour perception within the context in terms of luminance and chromaticity • Some examples of luminance contrast and chromatic contrast 31