Download

1 / 47
490 likes | 650 Vues
Tools of the Trade. Using tools to effectively analyze your data. Kristen Tompeck Marianne Oakes. Objectives . Share a variety of data analysis tools Provide examples for each tool Discuss the advantages and limitations of each tool. Quick share.

E N D
Tools of the Trade Using tools to effectively analyze your data Kristen Tompeck Marianne Oakes
Objectives Share a variety of data analysis tools Provide examples for each tool Discuss the advantages and limitations of each tool
Quick share What is the “state” of data at your school?
“An undefined problem has an infinite number of solutions.” Robert A. Humphrey
Data gives us the
What can we consider data? Summative assessments (OAKS, report card grades, graduation rates) Formative assessments (quizzes, exit tickets, homework Classroom observations (running records, notecards, rubrics, etc.) Attendance records Behavior records, incident records, discipline referrals
Precise What do the data say? Primary 55% of fifth-grade Riverdell students are scoring below the 50th percentile on easyCBM PRF at Winter Benchmark. 39 of 70 fifth-graders, or 55% are scoring below the 50th percentile on easyCBM PRF at Winter Benchmark. Skill deficits range from lack of prosody to the inability to read multi-syllabic words. Motivation does not appear to be an issue.
Break it down… • Primary Jamaal is struggling to read second-grade material. What do the data say? Precise Jamaal is struggling to decode words with r-controlled vowels and multi-syllabic words. His fluency falls between 35 and 45 cwpm and is a product of his decoding issues. His phrasing is appropriate when he can read the words.
Your turn…What additional data would you need to write a more precise statement?. According to winter Benchmark data, the number of second-grade students at “some risk” of reading failure is increasing. Some students at “low risk” in fluency do not have adequate comprehension.
Data Considerations… What do we need to consider when working with data?
Data Considerations Do the data reveal patterns or trends? Do the data raise new questions? Do we need more information? What about outliers or irregularities? What cautions should be considered?
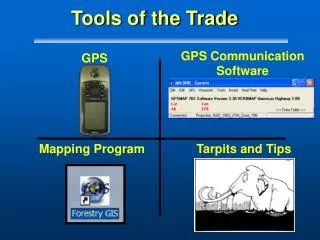
The Tools: Process & Procedures Wagon Wheel Quadrant Analysis Ishikawa Fishbone Force Field Analysis
Wagon Wheel Gives big picture view Compares many variables at once across several classrooms/grades Visually depicts relationships among variables Lots to discuss
Wagon Wheel Procedure: Determine variables, gather data Set scale, phrase all performance standards so highest percent is the outer circle Plot points, connect points for easier analysis
Wagon Wheel Template • Key Variables • 1. • 2. • 3. • 4. • 5. • 6. • 7. • 8. • Possibilities for Analysis • Grade level • Teachers • Student groups/subgroups • Domains/strands • Grades • Courses • Instructional Strategies-Training • Instructional Strategies-Implementation • Years (trends) 8 2 2 7 3 3 6 4 Wagon Wheel Template 5 1 S - 27
1 Students at Low Risk in winter Students making adequate progress Actual vs. allocated time Time in small group instruction Lesson plans with active engagement Instruction in 5 big ideas Participation in grade-level collaboration Objectives clearly articulated to students
Wagon Wheel in Excel Other Charts Radar
Quick Share How might you use this tool?
Quadrant Analysis Variable 2 Variable 1 Compares two variables Student oriented Indicates instructional groups
Quadrant Analysis Variable 2 Variable 1 Procedure: Choose two related variables, collect data Use data to group students
Quadrant Analysis Literacy Comprehension Fluency
Quadrant Analysis Math Algebraic Thinking (OAKS) Statistics (OAKS)
Quick Share How might you use this tool?
Ishikawa Fishbone Graphic organizer Analyzes cause &effect relationships Sorts causes into those we can affect and those we can’t Identifies goal Accessible
Ishikawa Fishbone Procedure: Identify area of weakness or desired outcome Identify root causes Determine teacher affected causes Use identified causes to determine goals “Catch & Release”
Effect Determine area of concern or desired outcome Causes Identify causes, differentiate teacher affected causes
Quick Share How might you use this tool?
Force Field Analysis • Identifies driving and restraining forces and related action steps • Prioritizes forces • Accessible, linear
Force Field Analysis Procedure: • Define the desired change • Brainstorm driving and restraining forces • Prioritize forces • Identify action steps
Quick Share How might you use this tool?
The Right Tool for the Job… Which tool would you choose? Why? Scenario 1 The math teachers administered the EasyCBM Fall Benchmark. Overall , students performed poorly and well below teacher expectations. The teachers are not sure where to begin.
The Right Tool for the Job… Which tool would you choose? Why? Scenario 2 The high school English teachers have been working on writing intensively for the past month. One class continues to struggle to be as successful as the other classes and over the last three assessments, scored significantly lower. It is concerning the entire department.
Tools of the Trade Thank you!