Download
1 / 103
1.14k likes | 2.32k Vues
Measurement Techniques. Eileen Kraemer August 27, 2002. Some definitions. State of system – defined by values of storage elements (memory, registers, etc.) Relevant subset : primary variables Others: auxiliary Event Change in a relevant state variable.

E N D
Measurement Techniques Eileen Kraemer August 27, 2002
Some definitions • State of system – • defined by values of storage elements (memory, registers, etc.) • Relevant subset : primary variables • Others: auxiliary • Event • Change in a relevant state variable
Classification of measurement techniques • Type A: - • number of times a state is visited during a time interval • Example: initiation of disk I/O per unit time • Type B: • Value of auxiliary variables when relevant state is entered • Example: number of processes in ready list when I/O initiates
Classification of measurement techniques • Type C: • Fraction or amount of time for which system is in a given state
Questions to ask… • When to collect info • How to collect info
How to know when to collect • Sample the system – check if system is in “relevant” state : sampled monitoring • Trace the system – look for event that marks entry to/exit from relevant state : trace monitoring
Tracing v. sampling • Tracing – can do A, B, C • Sampling – A, B may not be possible … • Miss some instances, multiply count some instances, if duration of state is shorter than inter-sample gap can estimate • Type C, can derive estimates
Instrumentation • Hardware monitoring • Pro: • doesn’t interfere w/normal function • Can capture fast events • Con: • Expensive • Many low-level events, difficult to “re-assemble” to correlate with higher-level operations • Useful for: • A and C type for fast-occurring events • Examples: device utilizations, cache hit rate, pipeline flush rate
Instrumentation • Software monitoring • Measurement code added to software or called from within software • Pro: • Flexible, general • Con: • Perturbation, difficulty with fast-occurring events • Useful for: • Info about user program, OS • Examples: time in routine X, page-fault frequency, average number of processors in state X
Instrumentation • Hybrid monitoring • Signals collected under software control, sent to another machine for measurement and processing • Pro: • Flexible,applicable to wide range • Con: • Synchronization requirements • Expensive, cumbersome
Tracing v. sampling • Both tracing and sampling applicable to all 3(hardware, software, hybrid monitoring)
Issues in selecting instrumentation/monitoring strategy • Accessibility • Software can’t get to HW functions • HW can’t easily relate low-level events to higher-level operations • Event frequency • SW can’t track if too rapid • HW or sampled SW • Monitor artifact • Measurement process may perturb workload, affecting accuracy of analysis
Issues in selecting instrumentation/monitoring strategy • Overhead • Reduce useful work by too large a margin • Flexibility • How easy to modify, upgrade instrumentation or change info being collected • SW easier than HW easier than hybrid
Obstacles to monitoring • Signals or state variables off-limits or unavailable: • security, privacy, protection, lack of documentation, source code unavailable, inaccessible location (on a chip) • Poor event resolution • Can get events, but insufficient info to classify (Example: can count I/O ops but can’t tell whether they’re from batch or interactive jobs) • Poor clock resolution • Inaccurate timing of fast occurring events
Hardware Monitoring • Based on a logic signal, S • 0->1 : state entered • 1->0 : state exited • May be synthesized from single bit and multi-bit signals • Boolean functions • Comparison functions
HM • May also need auxiliary signal, S’, to indicate which of several relevant states is occurring • Example: • S = 1: a new instruction fetched into IR • S’ = identity of opcode
HM • Type A measurements: • Increment counter on S:0->1 • Array of counters, indexed by S’ • Type B measurements: • On S:0->1, transfer auxiliary state info from backplane to registers or monitor memory module • Type C measurements: • Assume no S’ • Tracing: Time periods starting 0->1 and 1->0 … very hard to do for fast changing HW signals • Sampling most likely
HM • “silent observer” • Should have own counters, timers, logic synthesizers, memory modules, etc. rather than sharing HW w/ system under study • Typically don’t contribute to monitor artifact
Choosing the interval • Want to measure the fraction of time in “condition”? • Choose interval = 2^N clock pulses, where N is #bits in the counter … then don’t have to divide, result in counter IS fraction
Controlling the measurement process • Machine instruction or call to start measurement • Clear counter, interrupt generator and interrupt flag • Load event def register with right code • CPU should recognize interrupt posted by measurement circuit • Then read value in counter
Controlling the measurement process • HW monitor should have • entry in interrupt vector • event def register and counter should appear as command and data registers to the CPU • Interaction proceeds via normal bus interface • Can pick up other signals on data bus directly (instruction opcodes, operand addreses, operand values) • Other signals: • Explicitly put them on the bus to allow monitor to pick them up (then really hybrid monitoring) • Directly tap pins on chips(not on pin ->not avail)
Example • Consider a system with one CPU and n channels. Show the setup for measuring the fraction of time the CPU and k channels (for a given k in 1..n) are busy simultaneously.
Controlling measurement • Provide a system call, IO_OVERLAP(k,X) to spawn process • Determine function code to load into event definition register using parameter k • Init event def reg, clear both counters, reset interrupt latch (monitoring then starts automatically) • Block until monitor posts interrupt, then read value from duration counter, convert to real number, put in location X, exit
Sources of error…. • Consider previous with k=0 .. measures CPU utilization • Number of samples fixed at 2^N, info is statistical, N must be “large enough” to give significant info • Sampling frequency (clock rate) = f, interval T =2^N / f. For accurate results, S must make many transitions in T. • Avoid synch between sampling and sampled signal. (If perfectly synchronized, then value would be 100% or 0%)..
Example • Devise a sampled measurement technique for estimating the time spent by a program within a given loop.
Notes • Address bus carries real addresses • Won’t work in virtual memory system or if addresses not guaranteed to be contiguous • If memory management scheme permits programs to be dynamically relocated but contiguous, bounds registers must be reloaded every time the program is moved
Notes • PC holds instruction addresses • Why not use it instead of the address bus? • PC is inside microprocessor chip, can’t be accessed directly • PC address is virtual, several programs could have same set of virtual addresses
Notes • Because of sampling, time duration of experiment is only an approximation
Process-specific measurements • Difficult to do in hardware • Need to maintain identifying info in registers available to monitor
Software Monitoring • Well-suited for program-level measurements • Requires some support from OS and hardware: • Programmable timer • Virtual clock • Programmable virtual timer
Programmable timer • load with desired time interval, count down, generate an interrupt at time zero • Interrupt handling routine: • Read state variables, process collected data, close down experiment
Virtual clock • Needed for measuring process-specific time durations • Acts as a real-time clock that runs only while process n is executing • Single physical clock • Reserve slot in process control block (PCB) of each process for storing timer contents; store out/in on context switch
Programmable virtual timer • Runs down only when process n is executing • And associate arbitrary routine with expiration of timer • Similar to installing new device drivers, performed through system call interface, often in privileged mode
Trace Monitoring • Add extra code to program to record info when “interesting events” occur • Pro: • Flexibility • Con: • Instrumentation process may require detailed understanding of program • Added code may contain bugs • Added code may perturb in unexpected ways • Source code may be unavailable, undocumented, difficult to understand
gprof • Trace monitoring facility available under Berkeley Unix (and descendants) • To use: • Compile with –pg option (inserts monitoring code for each procedure call) • Computes average time take by each procedure, writes info to separate file • Can use –a option to obtain time take by major program blocks • We’ll try out soon ….
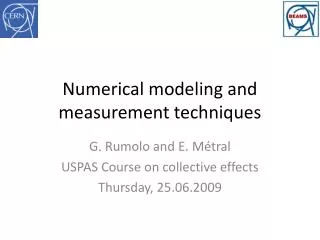
Interactive instrumentation environments • Similar idea to interactive debugger • Provide hooks in code, add instrumentation later • Pathfinder/QBV is example for DS
P3 P4 P1 P2 IM IM IM IM Pathfinder/QBV local snapshots steering requests Snapshot and Steering Manager global snapshots logical time Membership and ordering information and Consistency Detection local steering requests Snapshot and Steering Manager Presentation Manager Interaction Managers
Software Trace Monitoring • Example: • New compiler slower than expected… Found to be spending too much time manipulating the symbol table. Show how the fraction of time used for symbol table manipulations (frac) can be measured accurately.
Solution • Time spent manipulating symbol table depends on program being compiled – need set of randomly selected programs, or specifically selected set designed to be representative of actual workload • Use statistical techniques to analyze data
Solution, continued • Tot_time = time needed for compilation • ST-time = time spent manipulating symbol table • Frac = ST-time / Tot_time
Computing Tot_time • CPU time, usually available directly • To compute explicitly • At beginning of compilation initialize virtual clock • At end, read clock • Can modify compiler code, or by creating command line code (batch file) or calling program that does clock ops and calls compiler
Computing ST_time • Modify compiler • Add flag variable • Identify procedures that comprise ST_handling function • add measurement statements that depend on flag
Instrumentation of compiler routine Procedure pn(parameter list){ int start, end; if (measure_flag) start = read_virtual_clock(); …. if (measure_flag){ finish = read_virtual_clock(); ST_time += (start – finish); } }
Notes • Additional code affects (increases) both ST_time and Tot_time. • Tot_time more affected, thus frac is likely underestimated. • Use uninstrumented for Tot_time? • Estimate instrumentation effect and subtract?
Notes • Function call overhead can be significant … we aren’t measuring it • Solution: Start = read_virtual_clock(); Pn(param_list); Finish = read_virtual_clock(); ST_time= ST_time + (finish – start); • Con: • Requires modification of entire prog, not just module of interest • Alternate Solution • Measure function invocation overhead separately, and keep track of number of calls, then adjust accordingly
Notes • Other forms of perturbation may occur: • Change in workload, with effects on • Process scheduling • Page faults • Etc.


![[TC]²: Redefining Measurement Techniques](https://cdn4.slideserve.com/8405313/tc-redefining-measurement-techniques-dt.jpg)