Q3 Change Enablement Update: Progress, Challenges, and IT Service Levels
This report provides an update on the Change Enablement initiatives for Q3, highlighting planned versus unplanned deliveries, and methodologies for IT service support. Key metrics include the assessment of project scopes and impacts to ensure appropriate service delivery levels. The communication strategy has been refined to enhance clarity and accountability among teams. This update also introduces a scoring system to measure adherence to new job aids designed to improve the quality of communications related to IT services.

Q3 Change Enablement Update: Progress, Challenges, and IT Service Levels
E N D
Presentation Transcript
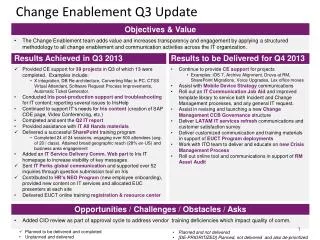
Change Enablement Q3 Update • Planned to be delivered and completed • Unplanned and delivered • Planned and not delivered • [DE-PRIORITIZED]Planned, not delivered and also de-prioritized
Legend: • Green: Always meets / exceeds expectations; Little/no risk • Amber: Partially meets / exceeds expectations; Some risk • Red: Rarely / never meets / exceeds expectations; High risk Change Enablement Support DashboardQ3 2013 Service Levels for IT Project Support (AMBER) Type of IT Service Delivery Emails Sent • Each project is assessed to understand the scope of impact and the degree of change to determine the service levels required for that effort and to plan accordingly. • Shows purpose of emails sent in Q3 from IT Service Delivery. Simple Change Low CE Support Complex Change High CE Support Volume for Across All Service Areas (GREEN) • The volume of tactics executed (created and / or approved) in Q3 were measured across each CE Service Category. Quality for IT Service Support (AMBER) • Created IT Communications Job Aid (click here to view) to assist both IM and CM teams, with step-by-step instructions and links to comms templates. • Reviewed IM WPD to ensure comms process and templates included. • Attended weekly MIM meetings to provide feedback. • Revamped CM roles and responsibilities to clarify who is accountable for what, which will in turn reduce miscommunications and need to retract communications to end user population. • Beginning to implement a scoring system to measure adherence to Job Aid which in turn drives quality.