Download
1 / 36
360 likes | 378 Vues
Explore how neighborhood conditions impact health outcomes in urban areas across the U.S., analyzing trends, disparities, and strategies for improvement using collaborative data analysis.

E N D
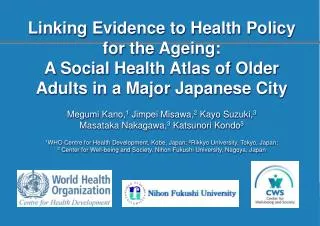
NEIGHBORHOODS AND HEALTH:Building Evidence for Local PolicyCross-Site Analysis Kathy Pettit and Tom Kingsley The Urban Institute
NNIP • Collaborative effort - Urban Institute and local partners in twenty cities • Partners operate local information systems • Recurrently updated neighborhood data • Multiple topics-data sources • Success from 3 kinds of innovations 1. Technological 2. Institutional • Using information for change • Competitive procurement this study • 9 proposals, 5 selected
Research questions Neighborhood conditions and health outcomes • Basic relationships health, demographic and contextual variables - Multiple cities, consistent definitions • Variations across sites • How relationships change over time • Long time series almost all sites • Specifically – 1990s trends in high-poverty areas • Feasibility – tract level analysis
5 sites - major differencesMetro area population growth- Slow in Cleveland and Providence- Rapid in Denver, moderate Indianapolis, Oakland
Racial/ethnic contrasts - Cleveland, Indianapolis: high share black- Denver, Providence: rapid Hispanic growth- Oakland: minority-majority expanding
Concentrated Poverty • Devastating effects, inner-city neighborhoods • Loss of the middle-class, institutions and role models • Concentration “magnifies poverty and exacerbates its effects.” • Concentration - seemingly inexorable trend • Major increases in 1970s and 1980s share of poor in high-poverty tracts • What happened in the 1990s?
Nationally – important reduction in concentrated poverty- Share of poor: down in high categories up in middle categories
Concen. poverty: bigger changes- major drops, Cleveland, Denver - modest declines, Indianapolis, Oakland - increase in Providence
% adults without HS degreeImprovements in high-povertyneighborhoods – all sites
% adults without HS degreebut major gaps remain rerest of city
% households rec. pub. assistanceMajor declines, high-povertyneighborhoods – all sites
Rental vacancy ratesTight housing markets exacerbate other problems
Research approach Neighborhood conditions and health outcomes • Scan of Birth and Mortality Outcomes -Diversity of levels and trends within & between cities • Examine relationships between health and neighborhood conditions • Bivariate and Multivariate analyses
Maternal and Infant Health Indicators • Pct. low-birth weight infants • Pct. of births to mothers with early prenatal care • Teen birth rates (age 15-19) • Age-adjusted mortality rate • Infant mortality rate
Gaps between poor/non-poor vary • Confirmed that gaps exist between high-poverty and non-poor tracts • BUT gaps vary by city and indicator • Gaps most consistent for prenatal care • Gaps generally lower in Oakland, Providence (smaller geographies)
Pct. low birth weight births, 1998/2000Large gaps seen in black/white cities
Some progress in health outcomes across all neighborhoods • Improvements in both high-poverty and non-poor neighborhoods • BUT generally not enough to close gaps • Direction and speed of change varies by city and indicator • Oakland generally saw most improvements • Teen birth, infant mortality rates dropped in all • Some troubling signs in Providence
Age-Adjusted Death RatesBegin together, but paths diverge High poverty census tracts
Lessons from Introductory Scan • Improvements are possible • Racial/ethnic differences • Change in teen births • Low birth rates • Policy and programs can have impact • Healthy Start • Campaign for Healthy Babies
Pathways of Neighborhood Effects on Health (Ellen et al. 2001) • Physical Stressors • Social Stressors • Neighborhood-based Networks & Norms • Neighborhood Institutions & Resources
Static Research Hypotheses Poorer birth & mortality outcomes will be associated with: • higher levels of minority and immigrant population • higher shares of low-income households • higher levels of social risk factors • poor housing quality • higher crime rates • more mobile and transient population
Dynamic Research Hypotheses Some relationships will remain positive, but have decreased in strength over the 1990s • high minority tracts and poor birth and mortality outcomes • lower-income tracts and lower prenatal care rates • lower-income tracts and higher low-birth weight rates
Socioeconomic Links Hold True • Poorer birth & mortality outcomes will be associated with: • higher levels of minority and immigrant population • True except for foreign-born with low-birth weight & mortality rates • higher shares of low-income households • True for all measures (poverty, income, TANF, public assistance) • higher levels of social risk factors • True for all measures (No HS, female-headed HH with children, unemployed)
Physical, Social Stressors Matter Social Network Proxies Mixed • Poorer birth & mortality outcomes will be associated with: • poor housing quality • True for all measures (older housing, overcrowded, home values and mortgage amounts) • higher crime rates • Not true for prenatal care, strongest with teen birth rates • more mobile and transient population • True for renter-occupancy & vacancy, mobility • Not true for change in population
Mixed results in link between non-white areas & poor health outcomes • Some relationships will remain positive, but have decreased in strength over the 1990’s: • High minority tracts and poor birth and mortality outcomes • True for low birth weight • Not true for prenatal care and pct. Hispanic • Not true for teen birth (much higher correlations) or mortality rates (about the same)
Again, mixed results in link between low-income areas & poor health outcomes • Some relationships will remain positive, but have decreased in strength over the 1990’s: • lower-income tracts and lower prenatal care rates • True but only slight drop in relationship • lower-income tracts and higher low-birth weight rates • True for all measures of income
Multivariate Regression • To test independent relationships of birth/mortality outcomes with neighborhood context variables • To test how much variation the neighborhood context variables explained • To test shifts over time for significance
Regression Model • Neighborhood Indicators • Pct. African-American, Pct. Hispanic • Average Family Income • Pct. population not employed • Pct pop > age 5 who moved in past 5 years • Dummy Variables • City, year, and interaction of city & year
Regression Summary • Regression strongest for prenatal care rates • R-Squared: .45 (teen births) to .77 (prenatal care) • Neighborhood variables did explain some variation • Pct. population not employed had highest coefficient • Conditions specific to time and place matter • not just due to racial or income change
How well do neighborhood conditions explain differences in rates? Reference City is Cleveland
Testing for significance of change in unobserved characteristics Differences in Early Prenatal Care Rates Reference is Cleveland 1999 rate
NEIGHBORHOODS AND HEALTH:Building Evidence for Local PolicyCross-Site Analysis Kathy Pettit and Tom Kingsley The Urban Institute