Download
1 / 30
300 likes | 419 Vues
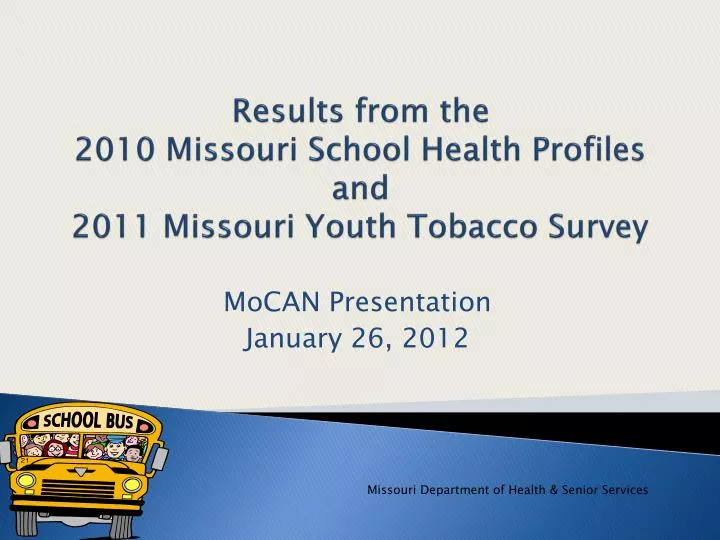
Results from the 2010 Missouri School Health Profiles and 2011 Missouri Youth Tobacco Survey . MoCAN Presentation January 26, 2012. Missouri Department of Health & Senior Services. Missouri 2010 School Health Profiles Summary.

E N D
Results from the 2010 Missouri School Health Profiles and 2011 Missouri Youth Tobacco Survey MoCAN Presentation January 26, 2012 Missouri Department of Health & Senior Services
Missouri 2010 School Health Profiles Summary • Conducted in even-numbered springs by MO Dept. of Elementary & Secondary Education in collaboration with CDC Division of Adolescent & School Health • School buildings with any grades 6-12 randomly selected to participate – 392 in 2010 • Two different questionnaires sent for principal and lead health education teacher • 310/392 principals responded • 302/392 health education teachers responded • Response sufficient to generalize data to all secondary school buildings and lead health education teachers Missouri Department of Health & Senior Services
Missouri 2010 School Health Profiles Summary Progress in school health programs & policies: • Less access to snack foods and beverages high in fats and calories • More school environments tobacco-free • More required health education taught • More individualized physical activity plans taught Missouri Department of Health & Senior Services
Missouri 2010 School Health Profiles Summary Concerns about school health programs & policies: • Fewer school health advisory groups • Less parent & community representation on groups • Fewer designated coordinators of school health • Less assessment of health programs & policies • Less professional development received by health education and physical education teachers although more desired by health education teachers Missouri Department of Health & Senior Services
Missouri 2010 School Health Profiles Summary • Percentage of secondary schools with someone who coordinates school health programs 2008 – 98.5% 2010 – 90.4%* • Percentage of secondary schools with school health advisory group 2008 – 78.2% 2010 – 62.8% *Statistically significant decrease Missouri Department of Health & Senior Services
Missouri 2010 School Health Profiles Summary Percentage of secondary schools with representation on school health advisory groups from: 2008 2010 • Health services staff 94.3 89.5 • School administrators 95.9 94.7 • Health education teachers 92.6 86.9 • Physical education teachers 89.5 86.9 • Nutrition or food service staff 90.6 75.6* • Parents or families of students 80.8 71.4* • Community members 77.6 65.9* • Local health departments or agencies 65.9 56.3* • Student body 69.4 60.9 • Mental health or social services staff 50.9 50.3 *Statistically significant decrease Missouri Department of Health & Senior Services
Missouri 2010 School Health Profiles Summary Percentage of secondary schools that used the School Health Index or other self-assessment tool to assess policies, activities or programs in: 2008 2010 • Physical activity 59.2 50.3* • Nutrition 59.0 47.0* • Tobacco-use prevention 54.3 45.4* • Asthma 37.4 31.7 *Statistically significant decrease Missouri Department of Health & Senior Services
Missouri 2010 School Health Profiles Summary • Percentage of secondary schools that always or almost always offer fruits or non-fried vegetables at school celebrations 2008 – 29.0 2010 – 23.9 • Percentage of secondary schools in which students can purchase snack foods or beverages at school 2002 – 89.6 2010 – 75.2* *Statistically significant decrease Missouri Department of Health & Senior Services
Missouri 2010 School Health Profiles Summary Percentage of secondary schools in which students can purchase the following snack foods or beverages at school: 2002 2006 2010* Chocolate candy 62.6 50.8 33.2 Other candy 62.4 54.9 37.5 Salty snacks not low in fat 69.1 60.9 38.7 2% or whole milk 50.2 37.2 Soda or non-100% fruit juice 74.2 43.8 Sports drinks 76.2 63.9 Foods or beverages with caffeine 47.9 38.4 *All statistically significant decrease from 2002 or 2006 Missouri Department of Health & Senior Services
Missouri 2010 School Health Profiles Summary Percentage of secondary schools that taught required health education, by grade and year 2008 2010* 6th – 42.6 59.7 7th – 61.4 79.9 8th – 57.8 82.1 9th – 46.2 76.0 10th – 24.6 39.0 11th – 11.1 21.6 12th – 10.7 21.5 *All statistically significant increase from 2008 Missouri Department of Health & Senior Services
Missouri 2010 School Health Profiles Summary Percentage of secondary schools that taught required physical education in 2010, by grade: 6th – 94.8 7th – 96.4 8th – 96.4 9th – 89.6 10th – 59.8 11th – 47.7 12th – 47.2 Missouri Department of Health & Senior Services
Missouri 2010 School Health Profiles Summary • Percentage of secondary schools that taught physical education using a written curriculum 2008 – 96.3 2010 – 92.3* • Percentage of secondary schools that taught students how to develop an individualized physical activity plan 2008 – 79.1 2010 – 85.2** *Statistically significant decrease **Statistically significant increase Missouri Department of Health & Senior Services
Missouri 2010 School Health Profiles Summary • Percentage of secondary schools that offer intramural activities or physical activity clubs 2008 – 58.8 2010 – 62.8 • Percentage of secondary schools in which physical education teachers received professional development on physical education during the past two years: 2008 – 90.1 2010 – 84.7* *Statistically significant decrease Missouri Department of Health & Senior Services
Missouri 2010 School Health Profiles Summary Percentage of lead health education teachers who received professional development in past two years, by topic: 2000 2010 Alcohol or other drug-use prevention 60.6 37.9* Emotional and mental health 32.9 36.5** Injury prevention and safety 41.2 49.5** Nutrition and dietary behavior 31.1 43.7** Physical activity and fitness 45.0 54.8** Suicide prevention 27.1 30.3** Violence prevention (bullying, fighting) 55.0 58.9** Tobacco-use prevention 36.2 30.7 STD prevention 32.2 26.8 Pregnancy prevention 24.2 21.1 HIV prevention 38.4 28.4 *Statistically significant decrease **Statistically significant increase Missouri Department of Health & Senior Services
Missouri 2010 School Health Profiles Summary Percentage of lead health education teachers who would like to receive professional development, by topic: 2000 2010 Alcohol or other drug-use prevention 66.5 74.8* Emotional and mental health 57.7 67.6* Injury prevention and safety 46.3 63.5* Nutrition and dietary behavior 62.7 73.2* Physical activity and fitness 56.5 73.3* Suicide prevention 67.7 73.3* Violence prevention 77.4 77.3 Tobacco-use prevention 60.0 69.6* STD prevention 61.9 64.5 Pregnancy prevention 55.2 63.1 HIV prevention 65.0 61.0 *Statistically significant increase Missouri Department of Health & Senior Services
Missouri 2010 School Health Profiles Summary Percentage of lead health education teachers who received professional development in past two years and would like to receive it, by topic in 2010: Received Would like Alcohol or other drug-use prevention 37.9 74.8 Emotional and mental health 36.5 67.6 Injury prevention and safety 49.5 63.5 Nutrition and dietary behavior 43.7 73.2 Physical activity and fitness 54.8 73.3 Suicide prevention 30.3 73.3 Violence prevention 58.9 77.3 Tobacco-use prevention 30.7 69.6 STD prevention 26.8 64.5 Pregnancy prevention 21.1 63.1 HIV prevention 28.4 61.0 Missouri Department of Health & Senior Services
Missouri 2010 School Health Profiles Summary Percentage of lead health education teachers who received professional development in past two years and would like to receive it, by topic in 2010: Received Would like Teaching students with disabilities 48.0 64.8 Teaching students of various cultural backgrounds 38.4 54.1 Teaching students with limited English proficiency 19.5 42.4 Encouraging family or community involvement 40.3 74.0 Using interactive teaching methods 61.1 65.0 Teaching skills for behavior change 50.0 77.4 Classroom management techniques 64.9 67.6 Assessing or evaluating students in health education 37.8 69.2 Missouri Department of Health & Senior Services
Recommendations • Reconvene or strengthen school health advisory council where needed • Identify someone to coordinate if none • Review 2010 Profiles findings and compare with own school • Celebrate areas where own school is better than rest of state • Identify areas on which to work, such as: • Use the School Health Index to assess policies and programs • Prioritize policy or program improvements needed and prepare plan to address Missouri Department of Health & Senior Services
Results from the Missouri Youth Tobacco Survey Missouri Department of Health & Senior Services
Results from the Missouri Youth Tobacco Survey • Conducted by the Missouri Department of Health & Senior Services in collaboration with the Centers for Disease Control and Prevention (CDC) Office on Smoking and Health • Randomly selected public middle and high schools and classrooms participate in spring of odd-numbered years • School and student participation is voluntary • Responses are anonymous and confidential • CDC provides the questionnaire booklet, and tabulates and weights the data • Results presented from the survey conducted in 2003, 2005, 2007, 2009 and 2011 Missouri Department of Health & Senior Services
Results from the Missouri Youth Tobacco Survey Also collect data on: • Current asthma • Overweight and obesity • Food and beverage consumption • Physical activity • Physical education • TV viewing and computer use Missouri Department of Health & Senior Services
Results from the Missouri Youth Tobacco Survey, 2011 Missouri Department of Health & Senior Services
Results from the Missouri Youth Tobacco Survey, 2011 Missouri Department of Health & Senior Services
Results from the Missouri Youth Tobacco Survey, 2011 Missouri Department of Health & Senior Services
Results from the Missouri Youth Tobacco Survey, 2011 Missouri Department of Health & Senior Services
Results from the Missouri Youth Tobacco Survey, 2011 Missouri Department of Health & Senior Services
Results from the Missouri Youth Tobacco Survey Tobacco content: • Tobacco Use • Quitting Attempts & Assistance • Youth Access to Cigarettes • Influences to Use Tobacco • Educating About the Dangers of Tobacco Use • Secondhand Smoke Exposure and Beliefs Missouri Department of Health & Senior Services
Results from the Missouri Youth Tobacco Survey Report of tobacco results from the Missouri Youth Tobacco Survey 2003-2011 will be available at: http://health.mo.gov/data/yts/data.php Missouri Department of Health & Senior Services
In the first 30 years of your life, you make your habits. For the last 30 years of your life, your habits make you. - Hindu saying
Janet WilsonMissouri Department of Health & Senior ServicesOffice of Epidemiology Janet.Wilson@health.mo.gov