Download
1 / 1
10 likes | 139 Vues
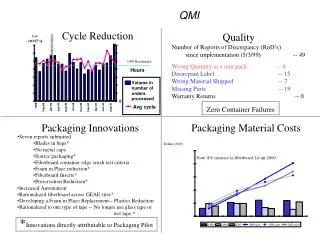
This report summarizes the significant improvements in order processing volumes and packaging efficiency from 1998 to 2000. It covers the average cycle times for orders, the number of reports of discrepancies since the implementation of quality measures in May 1999, and various issues such as incorrect quantities and material shipments. Additionally, the report details packaging innovations, including increased automation, the reduction of plastic and fiberboard materials, and the rationalization of packaging methods, reflecting a dedication to improving quality and reducing costs.

E N D
Volume in number of orders processed Avg cycle 1998 1999 2000 1998 cum 1999 cum 2000 cum QMI Cycle Reduction Quality Lot ) (MMT’s Number of Reports of Discrepancy ( RoD’s ) Implementation since implementation (5/3/99) -- 49 1998 Benchmark Wrong Quantity in a unit pack -- 8 Hours Discrepant Label -- 15 Wrong Material Shipped -- 7 Missing Parts -- 19 Warranty Returns -- 0 0 1998 Zero Container Failures Oct-99 Apr-99 Apr-00 Jun-99 Jun-00 Dec-99 Feb-99 Feb-00 Aug-99 Aug-00 Packaging Innovations Packaging Material Costs • Seven reports submitted • Blades in bags* Dollars (000) • No metal caps • Source packaging* Note: 8% increase in fiberboard 1st qtr 2000 • Fiberboard container edge crush test criteria • Foam in Place reduction* • Fiberboard Inserts* • Preservation Reduction* • Increased Automation • Rationalized fiberboard across GEAE sites* • Developing a Foam in Place Replacement-- Plastics Reduction • Rationalized to one type of tape -- No longer use glass tape or wet tape.* * Innovations directly attributable to Packaging Pilot