Download

1 / 8
80 likes | 195 Vues
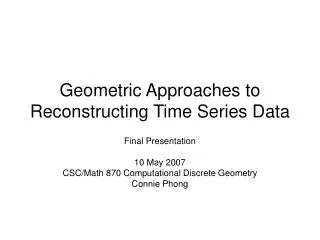
This project focuses on reconstructing time orderings from unordered or poorly ordered data sets, common in biological experiments like DNA microarrays. It aims to develop a theoretically rigorous algorithm that effectively addresses noise and errors. The approach integrates Minimum Spanning Tree (MST) algorithms and PQ-trees to estimate the ordering of data points based on their relationships. The research involves applying these techniques to biological datasets to enhance data analysis accuracy while minimizing uncertainties regarding the time sequence.

E N D
Geometric Approaches to Reconstructing Time Series Data Project Update 29 March 2007 CSC/Math 870 Computational Discrete Geometry Connie Phong
Objectives and Motivations • To reconstruct a time ordering from data without explicit time indices • Unordered or poorly ordered sets of observations are common in biological experiments such as DNA microarray experiments
Low noise and high sampling intensity? Output PQ tree showing uncertainties in the ordering Implementing a MST based algorithm Input weighted graph constructed from samples Calculate MST Find diameter path of the MST Compute diameter path statistics Output diameter path as the estimated ordering Create PQ-Tree from diameter path and MST Yes No
Yeast Microarray Dataset Rows – genes Columns – time points Magnitude of the ratio of induction to repression is indicated by color intensity: red indicates an increase in mRNA abundance and green indicates a decrease in mRNA abundance • Spellman et al.’s original dataset contains 6177 open reading frames • 18 time points, 7 min intervals • reduced to 5541 genes • ran algorithm on 500 genes exhibiting the most sample variation synchronized by treatment with alpha factor http://genome-www.stanford.edu/cellcycle/
Yeast Microarray Dataset Figure 3a: sample points in the space of the three largest principle coordinates Figure 3b: mst for the data with diameter path shown in bold noise = 0.2222 intensity = 0.0769 Figure 3f: known ordering and path
Yeast Microarray Dataset • Create PQ-tree [ {(1, 2, 3, 4, 5, 6, 7), 8, 9}, {17, 18, 10}, {16, 15, (14, 13, 12, 11)} ] • Costs of known ordering: 211.8194 • No relationship between cost of particular ordering and accuracy of the ordering • [1, 2, 3, 4, 5, 6, 7, 8, 9, 17, 18, 10, 11, 12, 13, 14, 16, 15] =209.5083[1, 2, 3, 4, 5, 6, 7, 8, 9, 10, 18, 17, 17, 15, 14, 13, 12, 11] =208.0588
Current Work • Researching principle curves • Researching Kalman filter • Compiling other datasets • A little bit of research on the implications of certain preprocessing steps • Overall objective: develop an algorithm for reconstructing time orderings that is more theoretically rigorous and addresses error and noise more succinctly