THE AS25 PROJECT: THE IA METHODOLOGY
250 likes | 536 Vues
THE AS25 PROJECT: THE IA METHODOLOGY (Presentation at the AIACC Asia Regional Workshop ) March 22-27 , 2003, Bangkok, Thailand By Yongyuan Yin 1 , Zhongmin Xu 2 and Jiaguo Qi 1 1. International Institute for Earth System Science, Nanjing University

THE AS25 PROJECT: THE IA METHODOLOGY
E N D
Presentation Transcript
THE AS25 PROJECT:THE IA METHODOLOGY (Presentation at the AIACC Asia RegionalWorkshop)March22-27, 2003, Bangkok, Thailand By Yongyuan Yin1, Zhongmin Xu2and Jiaguo Qi1 1. International Institute for Earth System Science, Nanjing University 2. State key laboratory of frozen soil engineering (CAREERI),Lanzhou
Outline • Study Objective • IA Research Framework • Data Collection • Sensitivity Identification • Vulnerability Assessment • Adaptive Capacity Assessment • Vulnerability under Climate Change • Adaptation Policy Evaluation
Research Methodology • Data collection with RS and GIS • Climate scenarios and extremes • Prof. Ding Yihui: RCM of China • CIDA C5 project CC Scenario Workshop • Socio-economic scenarios • Dr. Shuming Bao: Database of China • National West China Development Strategy • Field work, literature review, and survey • Dr. Zhongmin Xu: EF and CVM Methods
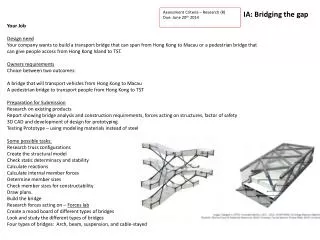
Remote Sensing Land Use and Land Cover Dynamics of Zhangye Region in Western China (Source: Qi et al., 2002) • Image Processing Methods: • Unsupervised classification • Supervised classification • Continuous field: fractional vegetation • Change detection of urban expansion
Study Area Zhangye Region is a typical representation of climate, social, geology, ecology and hydrology of western China
Image Sources Three Landsat images over a span of 25 years have been used
Results: land cover change Agricultural land expansion is obvious
Results_land degradation Results: land degradation change Fractional vegetation cover changed as well
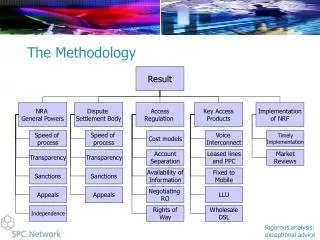
Potential sensitivity matrix showing the climate variables with thegreatest forcing and activities with the broadest sensitivity in Western China (Modified from:Hennessy and Jones, 1999)
Methods Vulnerability and Adaptive Capacity Assessment • Environmental Risk = exposure frequency (probability) consequence • Consequence= F{intensity, sensitivity, adaptive capacity} • Selecting Vulnerability and Adaptive Capacity Indicators • Identifying Critical Thresholds for Indicators • Setting Priorities to Vulnerability Indicators • Vulnerability Classification by the Fuzzy Set Model • Adaptive Capacity Classification by the Fuzzy Set Model
Methods Vulnerability and Adaptive Capacity Assessment • Both quantitative and qualitative methods will be employed. • Numerical numbers can be derived for those climate and physical variables: drought index, soil loss tolerance, and • EVf = Max [0, LFt-Ft, Ft-UFt] • Where: EVf is water system’s maximum-extent vulnerability based on river flow indicator; LFt and UFt are the lower and upper critical thresholds of the coping range respectively; and Ft is the observed river flow data. • Yohe and Tol (2001) suggest that the relationships between adaptive capacity and its determinants are difficult to quantify.
Ecological footprint’s diversity, capacity and intensity in China and provinces Notes: In the analysis of diversity, because of some flaws in the data, we deleted two provinces (Hebei and Zhejiang).
Distribution of survey willingness to pay responses *Classified as a protest response. ** Due to numeric rounding, the totals do not equal to one hundred percent.
Total benefits of households in Hei valley *calculated by compound interest.
Vulnerability and adaptive capacity indicators SectorsIndicators Water resources VI water demand, water storage stress, water stress, hydropower, EI water supply climate variables, Palmer drought severity index, low flow event frequency and duration, ACI economic return, industry productivity, regulated annual supply, institutional frameworks Agriculture VI population growth, water resource consumption, arable land loss, food consumption EI cold snap, heat stress days, monsoon pattern, accumulated degree days, water supply, Palmer drought severity index ACI farm income, agricultural product price, agricultural production, Ecosystems VI soil erosion, desertification, sand storm, population growth rate, population density EI water supply, high winds Number of days, sand storms, Palmer drought severity index, heat stress days, cold snap days, ACI forest area protection, emission reduction of CO2, ecological protection -------------------------- Note: VI=vulnerability indicator; EI= Exposure indicators; ACI=adaptive capacity indicator
Vulnerability Classification by the Fuzzy Set Model The sets, U, of classification criteria and V of vulnerability levels can be specified as follows: U = {(temperature), (rainfall), (low flow event frequency), (low flow event duration), (causality and/or injury), (damage to ecosystem), (water use conflicts), …} V = {(extremely vulnerable), (high risk), (moderate risk), (low risk), (acceptable)} The problem under consideration is how to assign different land units into proper categories of overall vulnerability level on the basis of the given data and criteria, and thus partition the whole region into several sub-regions with unique vulnerability patterns.
Adaptive Capacity Classification by the Fuzzy Set Model The sets, U, of classification criteria and V of adaptive capacity levels can be specified as follows: U = {(economic return), (industry productivity), (technology advancement), (regulated annual supply), (institutional frameworks), (water storage capacity), …} V = {(extremely adaptive), (high adaptive), (moderate adaptive), (low adaptive), (acceptable)} Since factors influencing adaptive capacity may be different from vulnerability indicators, criteria selected in the U set equation are thus different from the vulnerability criteria set. The factors affecting a system’s adaptive capacity are usually those economic, technological, and social in nature.
Measure Vulnerabilities to Future Climate Change • Various methods can be applied to estimate indicator values in the future. This will produce future data for each indicator. Since water system vulnerability is critical in Western China, we use it as an example to illustrate the research steps. • Hydrologic simulation models will be employed to project the levels of vulnerabilities indicators of the hydrologic system (e.g. stream-flow, velocities and qualities) under climate change. • Water Resources System (Integrated Assessment) model can provide a means for integrating climate change vulnerabilities and regional adaptive capacity in the structure of the model by a clear articulation and reconciliation of objective functions and decision variables.
Prioritizing Adaptation Options or Policies Adopt a multi-criteria decision making technique, Analytic Hierarchy Process (AHP), to identify desirable adaptation options to reduce climate vulnerabilities and to improve adaptive capacity.
Applying AHP (Analytical Hierarchy Process) to identify desirable adaptation options AHP (developed by Saaty), can be used: • to provide a means by which alternative options can be compared and evaluated in an orderly and systematic manner; • to evaluate alternative policies, allocate resources, and select desirable project locations.
Acknowledgements The research project and participation of this workshophave been made possible through the financial support of the AIACC, Adaptation and Impacts Research Group/Environment Canada, and Sustainable Development Research Institute/University of British Columbia.