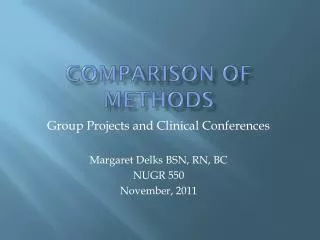
Component based SEM Comparison between various methods
Component based SEM Comparison between various methods. Michel Tenenhaus. SEM. Component-based SEM (Score computation). Covariance-based SEM (CSA) (Model estimation). H. Hwang Y. Takane GSCA (2004). (AMOS 6.0, 2007). Herman Wold NIPALS (1966) PLS approach (1975). Score computed

Component based SEM Comparison between various methods
E N D
Presentation Transcript
Component based SEMComparison between various methods Michel Tenenhaus
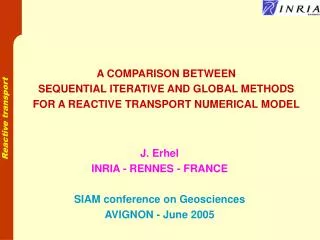
SEM Component-based SEM (Score computation) Covariance-based SEM (CSA) (Model estimation) H. Hwang Y. Takane GSCA (2004) (AMOS 6.0, 2007) Herman Wold NIPALS (1966) PLS approach (1975) Score computed using block MV loadings For good blocks (High Cronbach ): - Score = 1st PC - Score = MV’s J.-B. Lohmöller LVPLS 1.8 (1984) H. Hwang VisualGSCA 1.0 (2007) W. Chin PLS-Graph Path analysis on the structural model defined on the scores Chatelin-Esposito Vinzi Fahmy-Jäger-Tenenhaus XLSTAT-PLSPM (2007) A Component-based SEM tree ALL BLOCK REFLECTIVE Path-PCA ULS-SEM GSCA Path-Scale PLS When the blocks are heterogeneous, GSCA is too close to PCA. PLS and SEM give almost the same results. M. Tenenhaus : Component-based SEM Total Quality Management, 2008 When all blocks are good, all the methods give almost the same results.
The ECSI model Fairly good blocks
Comparison between the LVs coming from the 5 methods PCA ULS-SEM SCALE PLS GSCA When all blocks are good, all the methods give almost the same results.
ECSI model with noise Noise variables are highly correlated (> .99) and uncorrelated with Customer Satisfaction MVs. For this new block: - Noise = 1st PC - Customer Satisfaction = 2nd PC
GSCA is trapped !!!! Fornell weights when the augmented Customer Satisfaction block is heterogeneous and reflective
PCA Why GSCA is trapped The GSCA criterion MSEV, Glang (1988) MSEV = Maximum Sum of Explained Variance
For reflective blocks, GSCA seemsto be too close to PCA Fornell weights for original ECSI model
GSCA is still trapped !!!! Fornell weights when the augmented Customer Satisfaction block is heterogeneous and formative
Component-based SEM (Score computation) H. Hwang VisualGSCA 1.0 (2007) Herman Wold PLS approach (1975) Mathes (1994) M. Glang MSEV (1988) = Glang and Hwang criteria are equivalent. PLS Critical points Computational practice: PLS Maximum A Component-based SEM tree ALL BLOCK FORMATIVE
GSCA R2=.491 R2=.263 R2=.380 R2=.691 R2=.301 R2=.313
* Criterion optimized by the method Comparison between methods * * * Practice supports “theory”
Comparison between the LVs coming from the 3 methods B + Centroid B + Factorial GSCA When all blocks are good, all the methods give almost the same results.
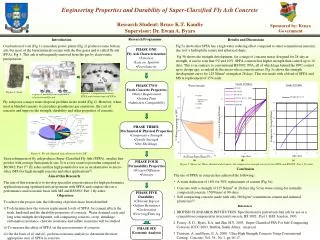
Economic inequality and political instability (Russet) Agricultural inequality (X1) INST GINI + + + ECKS + FARM 1 + + + DEAT RENT - 3 D-STB + GNPR + + D-INS - 2 LABO - DICT Industrial development (X2) Political instability (X3)
Use of XLSTAT-PLSPMMode B + Centroid scheme Y1 = X1w1 Y3 = X3w3 Y2 = X2w2
Use of XLSTAT-PLSPMMode B + Factorial scheme Y1 = X1w1 Y3 = X3w3 Y2 = X2w2
Use of GSCA (All formative) When there is only one structural equation and when all blocks are formative,GSCA is equivalent to a canonical correlation analysis.
Use of XLSTAT-PLSPM for two blocksMode B Canonical Correlation Analysis
* Criterion optimized by the method Comparison between methods * * * * Practice supports “theory”
When the blocks are good (or moderately good) all methods seems to give almost the same LV scores. When some blocks are heterogeneous, PLS and ULS-SEM seems to give better results than GSCA. For all formative blocks : GSCA criterion is a more natural criterion than the PLS ones. For all formative blocks : PLS give good results for multiblock data analysis. Conclusion
« All the proofs of a pudding are in the eating, not in the cooking ». Final conclusion William Camden (1623)