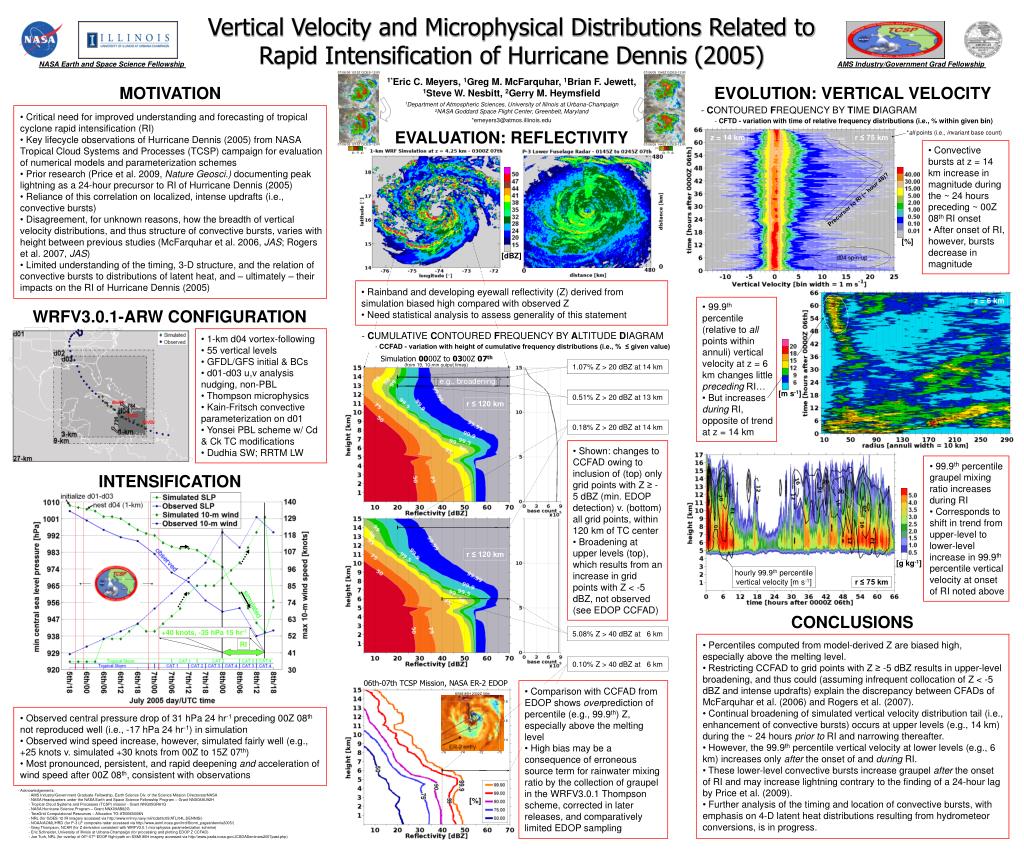
Critical need for improved understanding and forecasting of tropical cyclone rapid intensification (RI) • Key lifecycle observations of Hurricane Dennis (2005) from NASA Tropical Cloud Systems and Processes (TCSP) campaign for evaluation of numerical models and parameterization schemes • Prior research (Price et al. 2009, Nature Geosci.) documenting peak lightning as a 24-hour precursor to RI of Hurricane Dennis (2005) • Reliance of this correlation on localized, intense updrafts (i.e., convective bursts) • Disagreement, for unknown reasons, how the breadth of vertical velocity distributions, and thus structure of convective bursts, varies with height between previous studies (McFarquhar et al. 2006, JAS; Rogers et al. 2007, JAS) • Limited understanding of the timing, 3-D structure, and the relation of convective bursts to distributions of latent heat, and – ultimately – their impacts on the RI of Hurricane Dennis (2005) • Convective bursts at z = 14 km increase in magnitude during the ~ 24 hours preceding ~ 00Z 08th RI onset • After onset of RI, however, bursts decrease in magnitude [°C] [°C] -70 -70 -80 -80 -60 -60 [%] • Rainband and developing eyewall reflectivity (Z) derived from simulation biased high compared with observed Z • Need statistical analysis to assess generality of this statement • 99.9th percentile (relative to all points within annuli) vertical velocity at z = 6 km changes little preceding RI… • But increases during RI, opposite of trend at z = 14 km • 1-km d04 vortex-following • 55 vertical levels • GFDL/GFS initial & BCs • d01-d03 u,v analysis nudging, non-PBL • Thompson microphysics • Kain-Fritsch convective parameterization on d01 • Yonsei PBL scheme w/ Cd & Ck TC modifications • Dudhia SW; RRTM LW [m s-1] • Shown: changes to CCFAD owing to inclusion of (top) only grid points with Z ≥ -5 dBZ (min. EDOP detection) v. (bottom) all grid points, within 120 km of TC center • Broadening at upper levels (top), which results from an increase in grid points with Z < -5 dBZ, not observed (see EDOP CCFAD) • 99.9th percentile graupel mixing ratio increases during RI • Corresponds to shift in trend from upper-level to lower-level increase in 99.9th percentile vertical velocity at onset of RI noted above [g kg-1] • Percentiles computed from model-derived Z are biased high, especially above the melting level. • Restricting CCFAD to grid points with Z ≥ -5 dBZ results in upper-level broadening, and thus could (assuming infrequent collocation of Z < -5 dBZ and intense updrafts) explain the discrepancy between CFADs of McFarquhar et al. (2006) and Rogers et al. (2007). • Continual broadening of simulated vertical velocity distribution tail (i.e., enhancement of convective bursts) occurs at upper levels (e.g., 14 km) during the ~ 24 hours prior to RI and narrowing thereafter. • However, the 99.9th percentile vertical velocity at lower levels (e.g., 6 km) increases only after the onset of and during RI. • These lower-level convective bursts increase graupel after the onset of RI and may increase lightning contrary to the finding of a 24-hour lag by Price et al. (2009). • Further analysis of the timing and location of convective bursts, with emphasis on 4-D latent heat distributions resulting from hydrometeor conversions, is in progress. 1.07% Z > 20 dBZ at 14 km 5.08% Z > 40 dBZ at 6 km 0.18% Z > 20 dBZ at 14 km 0.10% Z > 40 dBZ at 6 km 0.51% Z > 20 dBZ at 13 km SSMI 85H 2302Z 06th • Comparison with CCFAD from EDOP shows overprediction of percentile (e.g., 99.9th) Z, especially above the melting level • High bias may be a consequence of erroneous source term for rainwater mixing ratio by the collection of graupel in the WRFV3.0.1 Thompson scheme, corrected in later releases, and comparatively limited EDOP sampling 18 • Observed central pressure drop of 31 hPa 24 hr-1 preceding 00Z 08th not reproduced well (i.e., -17 hPa 24 hr-1) in simulation • Observed wind speed increase, however, simulated fairly well (e.g., +25 knots v. simulated +30 knots from 00Z to 15Z 07th) • Most pronounced, persistent, and rapid deepening and acceleration of wind speed after 00Z 08th, consistent with observations 16 14 -76 -74 -72 -70 Vertical Velocity and Microphysical Distributions Related to Rapid Intensification of Hurricane Dennis (2005) NASA Earth and Space Science Fellowship AMS Industry/Government Grad Fellowship 07/06/05 1015Z GOES-12 IR 07/06/05 1345Z GOES-12 IR 1*Eric C. Meyers, 1Greg M. McFarquhar, 1Brian F. Jewett, 1Steve W. Nesbitt, 2Gerry M. Heymsfield MOTIVATION EVOLUTION: VERTICAL VELOCITY 1Department of Atmospheric Sciences, University of Illinois at Urbana-Champaign 2NASA Goddard Space Flight Center, Greenbelt, Maryland - CONTOURED FREQUENCY BY TIME DIAGRAM *emeyers3@atmos.illinois.edu • CFTD - variation with time of relative frequency distributions (i.e., % within given bin) EVALUATION: REFLECTIVITY *all points (i.e., invariant base count) z = 14 km r ≤ 75 km 07/06/05 1215Z GOES-12 IR 07/06/05 1445Z GOES-12 IR Precursor to RI (~ hour 48)? [dBZ] d04 spin-up z = 6 km WRFV3.0.1-ARW CONFIGURATION - CUMULATIVE CONTOURED FREQUENCY BY ALTITUDE DIAGRAM • CCFAD - variation with height of cumulative frequency distributions (i.e., % ≤ given value) Simulation 0000Z to 0300Z 07th (from 19, 10-min output times) e.g., broadening r ≤ 120 km INTENSIFICATION r ≤ 120 km hourly 99.9th percentile vertical velocity [m s-1] r ≤ 75 km CONCLUSIONS +40 knots, -35 hPa 15 hr-1 RI 06th-07th TCSP Mission, NASA ER-2 EDOP • Acknowledgements: • AMS Industry/Government Graduate Fellowship, Earth Science Div. of the Science Mission Directorate/NASA • NASA Headquarters under the NASA Earth and Space Science Fellowship Program – Grant NNX08AU92H • Tropical Cloud Systems and Processes (TCSP) mission - Grant NNG05GR61G • NASA Hurricane Science Program – Grant NNX09AB82G • TeraGrid Computational Resources – Allocation TG-ATM060008N • NRL (for GOES-12 IR imagery accessed via http://www.nrlmry.navy.mil/tcdat/tc05/ATL/04L.DENNIS/) • NOAA/AOML/HRD (for P-3 LF composite radar accessed via http://www.aoml.noaa.gov/hrd/Storm_pages/dennis2005/) • Greg Thompson, NCAR (for Z derivation consistent with WRFV3.0.1 microphysics parameterization scheme) • Eric Schneider, University of Illinois at Urbana-Champaign (for processing and plotting EDOP Z CCFAD) • Joe Turk, NRL (for overlay of 06th-07th EDOP flight path on SSMI 85H imagery accessed via http://www.jcsda.noaa.gov/JCSDASeminars2007past.php) [%]