BASICS OF EPIDEMIC MODELLING
400 likes | 697 Vues
BASICS OF EPIDEMIC MODELLING. Kari Auranen Department of Vaccines National Public Health Institute (KTL), Finland Division of Biometry, Dpt. of Mathematics and Statistics University of Helsinki, Finland. Outline. A simple epidemic model to exemplify dynamics of transmission

BASICS OF EPIDEMIC MODELLING
E N D
Presentation Transcript
BASICS OF EPIDEMIC MODELLING Kari Auranen Department of Vaccines National Public Health Institute (KTL), Finland Division of Biometry, Dpt. of Mathematics and Statistics University of Helsinki, Finland
Outline • A simple epidemic model to exemplify • dynamics of transmission • epidemic threshold • herd immunity threshold • basic reproduction number • the effect of vaccination on epidemic cycles • mass action principle
Outline (2) • The Susceptible - Infected - Removed (SIR) model • endemic equilibrium • force of infection • estimation of the basic reproduction number R • effect of vaccination • The SIS epidemic model • R and the choice of the model type • age-specific proportions of susceptibles/infectives 0 0
A simple epidemic model (Hamer, 1906) • Consider an infection that • involves three states/compartments of infection: • proceeds in discrete generations (of infection) • is transmitted in a homogeneously mixing population of size N Susceptible Case Immune
Dynamics of transmission • Dependence of generation t+1 on generation t: • C = R x C x S / N • S = S - C + B t + 1 0 t t t+1 t t+1 t S = number of susceptibles at time t C = number of cases (infectious individuals) at time t B = number of new susceptibles (by birth) t t t
Dynamics of transmission Epidemic threshold : S = N/R e 0
Epidemic threshold S e • S - S = - C + B • the number of susceptibles increases when C < B • decreases when C > B • the number of susceptibles cycles around the epidemic threshold S = N / R • this pattern is sustained as long as transmission is possible t+1 t t+1 t t+1 t t t+1 e 0
Epidemic threshold • C / C = R x S / N = S / S • the number of cases increases when S > S • decreases when S < S • the number of cases cycles around B (influx of new susceptibles) t+1 t 0 t t e e e t
Herd immunity threshold • incidence of infection decreases as long as the proportion of immunes exceeds the herd immunity threshold • H = 1- S / N • a complementary concept to the epidemic threshold • implies a critical vaccination coverage e
Basic reproduction number (R ) 0 • the average number of secondary cases that an infected individual produces in a totally susceptible population during his/her infectious period • in the Hamer model : R = R x 1 x N / N = R • herd immunity threshold H = 1 - 1 / R • in the endemic equilibrium: S = N / R , i.e., 0 0 0 0 e 0 R x S / N = 1 e e 0 0
Basic reproduction number (2) R = 3 0
Basic reproduction number (3) R = 3 endemic equilibrium 0 R x S / N = 1 0 e
Herd immunity threshold and R 0 H = 1-1/R 0 (Assumes homogeneous mixing)
Effect of vaccination Hamer model under vaccination S = S - C + B (1- VCxVE) Vaccine effectiveness (VE) x Vaccine coverage (VC) = 80% t t+1 t+1 Epidemic threshold sustained: S = N / R e 0
Mass action principle • all epidemic/transmission models are variations of the use of the mass action principle which • captures the effect of contacts between individuals • uses the analogy to modelling the rate of chemical reactions • is responsible for indirect effects of vaccination • assumes homogenous mixing • in the whole population • in appropriate subpopulations
The SIR epidemic model • a continuous time model: overlapping generations • permanent immunity after infection • the system descibes the flow of individuals between the epidemiological compartments • uses a set of differential equations Susceptiple Infectious Removed
The SIR model equations = birth rate = rate of clearing infection = rate of infectious contacts by one individual = force of infection
Endemic equilibrium (SIR) N = 10,000 = 300/10000 (per time unit) = 10 (per time unit) = 1 (per time unit) 0
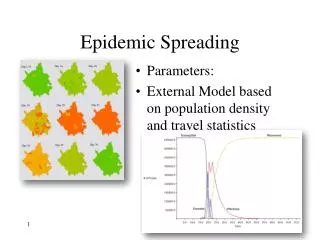
The basic reproduction number (SIR) • Under the SIR model, Ro given by the ratio of two rates: • R = = rate of infectious contacts x • mean duration of infection • R not directly observable • need to derive relations to observable quantities 0 0
Force of infection (SIR) • the number of infective contacts in the population per susceptible per time unit: • (t) = x I(t) / N • incidence rate of infection: (t) x S(t) • endemic force of infection (SIR): = x (R - 1) 0
Estimation of R (SIR) 0 Relation between the average age at infection and R (SIR model) 0 = 1/75 (per year)
A simple alternative formula • Assume everyone is infected at age A • everyone dies at age L (rectangular age distribution) Proportion 100 % Susceptibles Immunes Proportion of susceptibles: S / N = A / L R = N / S = L / A e A L e 0 Age (years)
Estimation of and Ro from seroprevalence data 1) Assume equilibrium 2) Parameterise force of infection 3) Estimate 4) Calculate Ro Ex. constant Proportion not yet infected: 1 - exp(- a) , estimate = 0.1 per year gives reasonable fit to the data
Estimates of R 0 * * * * Anderson and May: Infectious Diseases of Humans, 1991
Indirect effects of vaccination (SIR) • Vaccinate proportion p of newborns, assume complete protection against infection • R = (1-p) x R • If p < H = 1-1/R , in the new endemic equilibrium: • S = N/R , = (R -1) • proportion of susceptibles remains untouched • force of infection decreases vacc 0 0 e 0 vacc vacc
Effect of vaccination on average age A’ at infection (SIR) • Life length L; proportion p vaccinated at birth, complete protection • every susceptible infected at age A Susceptibles S / N = (1-p) A’/L S / N = A/ L => A’ = A/(1-p) i.e., increase in the average age of infection Proportion e 1 e Immunes p A ’ L Age (years)
Vaccination at age V > 0 (SIR) • Assume proportion p vaccinated at age V • Every susceptible infected at age A • How big should p be to obtain herd immunity threshold H Proportion H = 1 - 1/R = 1 - A/L H = p (L-V)/L => p = (L-A)/(L-V) 1 Susceptibles p i.e., p bigger than when vaccination at birth Immunes V A L Age (years)
The SIS epidemic model • herd immunity threshold : H = 1 - 1/R • endemic force of infection: • the proportions of susceptibles and immunes different from the SIR model Susceptible Immune 0
SIS and SIR R and the force of infection 0 No immunity to infection (SIS) Lifelong immunity to infection (SIR) birth rate = 1/75 (per year) rate of clearing infection = 2.0 (per year) birth rate = 1/75(per year)
Extensions of simple models • So far all models assumed • homogeneous mixing • constant force of infection across age (classes) • More realistic models incorporate • heterogeneous mixing • age-dependent contact/transmission rates • social structures: families, DCC’s, schools, etc.
Extensions of simple models (2) • seasonal patterns in risks of infection • latency, maternal immunity etc. • different vaccination strategies • different models for vaccine effectiveness • Stochastic models to • model chance phenomena • time to eradication • apply statistical techniques
Example: structured models Contact structures (WAIFW) • structure of the Who Acquires Infection From Whom matrix for varicella , five age groups (0-4, 5-9, 10-14, 15-19, 20-75 years) table entry = rate of transmission between an infective and a susceptible of respective age groups e.g., force of infection in age group 0-4: a*I1 + a*I2 + c*I3 + d*I4 + e*I5 I1 = equilibrium number of infectives in age group 0-4, etc. • WAIFW matrix non-identifiable from age-specific incidence !
References • Fine P.E.M, "Herd immunity: History, Theory, Practice", Epidemiologic Reviews, 15, 265-302,1993 • Fine P.E.M., "The contribution of modelling to vaccination policy, Vaccination and World Health, Eds. F.T. Cutts and P.G. Smith, Wiley and Sons, 1994. • Haber M., "Estimation of the direct and indirect effects of vaccination", Statistics in Medicine, 18, 2101-2109, 1999 • Halloran M.E., Cochi S., Lieu T.A., Wharton M., Fehrs L., "Theoretical epidemologic and mordibity effects of routine varicella immunization of preschool children in the U.S.", AJE, 140, 81-104, 1994 • Levy-Bruhl D., lecture notes in the EPIET course, Helsinki, 1998. • Nokes D.J., Anderson R.M., "The use of mathematical models in the epidemiological study of infectious diseases and in the desing of mass immunization programmes", Epidemiology and Infection, 101, 1-20, 1988 • Lipsitch M., "Vaccination against colonizing bacteria with multiple serotypes", Population Biology, 94, 6571-6576, 1997 • Anderson R.M. and May R.M., ”Infectious Diseases of Humans”; Oxford University Press, 1992.