Download
1 / 37
370 likes | 525 Vues
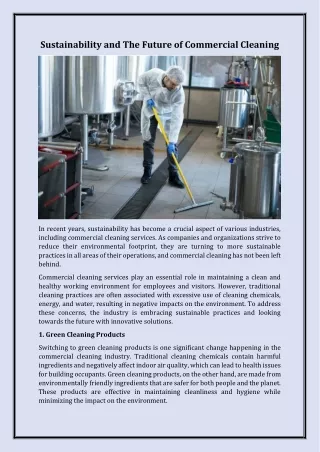
Perspectives on the Future of Transportation and Sustainability Oregon’s Role in the Emerging Electric Vehicle (EV) Industry. John Thornton Vice President of Manufacturing & Supply Chain Porteon Electric Vehicles Oregon SAE Luncheon Meeting February 29, 2008. Topics.

E N D
Perspectives on the Future of Transportation and Sustainability Oregon’s Role in the Emerging Electric Vehicle (EV) Industry John Thornton Vice President of Manufacturing & Supply ChainPorteon Electric Vehicles Oregon SAE Luncheon Meeting February 29, 2008
Topics Context: Why are electric vehicles (EVs) important? What are the benefits of an electric vehicle (EV)? What does it take to build a practical electric car for families? Will EVs require new infrastructure? Will EVs require new technology? Oregon’s prospects in the emerging EV market.
Air Quality Land Use Air Quality Land Use X X Fuel Prices Fuel Prices Population Growth Congestion Population Growth Congestion Transportation Problems CONFIDENTIAL
X X Fuel Prices Fuel Prices Transportation Problems Air Quality Land Use Air Quality Land Use Energy Supply Climate Change Climate Change Energy Supply Population Growth Congestion Population Growth Congestion CONFIDENTIAL
Mobility: History & Projections Schafer A, Victor D. The future mobility of the world population. Transportation Research Part A 2000;34:171-205.
Global Transportation Energy Consumption by Fuel IEA Key world energy statistics 2005. IEA, Paris. See also: http://www.iea.org/dbtwwpd/Textbase/nppdf/free/2005/key2005.pdf
Liquid Fuels Electricity Hydrogen Electricity as the Ultimate Flexible Fuel Energy Carrier
Liquid Fuels Electricity Hydrogen Electricity as the Ultimate Flexible Fuel Energy Resource Conversion Energy Carrier Oil(Conventional) Oil(Non-conventional) Renewables(Wave, Tidal, Geo,Solar, Wind) Syngas Biomass Natural Gas Coal Nuclear
Liquid Fuels Electricity Hydrogen Electricity as the Ultimate Flexible Fuel Energy Resource Conversion Energy Carrier Propulsion System Conventional ICE:Gasoline/Diesel Oil(Conventional) Oil(Non-conventional) Renewables(Wave, Tidal, Geo,Solar, Wind) Syngas ICE Hybrid(HEV) Plug-in Hybrid ICE(PHEV–Parallel) Biomass Electrification Extended Range EV: (PHEV–Serial) Natural Gas Battery Battery Electric (EV) Coal Fuel Cell Electric(FCEV) Nuclear
Liquid Fuels Renewables(Wave, Tidal, Geo,Solar, Wind) Renewables(Wave, Tidal, Geo,Solar, Wind) Electricity Electricity Extended Range EV: (PHEV–Serial) Extended Range EV: (PHEV–Serial) Battery Electric (EV) Battery Electric (EV) Hydrogen Electricity as the Ultimate Flexible Fuel Energy Resource Conversion Energy Carrier Propulsion System Conventional ICE:Gasoline/Diesel Oil(Conventional) Oil(Non-conventional) Syngas ICE Hybrid(HEV) Plug-in Hybrid ICE(PHEV–Parallel) Biomass Electrification Natural Gas Battery Coal Fuel Cell Electric(FCEV) Nuclear
Electricity – Growing Greener US annual CO2 output emission rate (lb/MWh)
Electricity – Growing Greener US annual CO2 output emission rate (lb/MWh)
Electricity – Growing Greener: Renewable Portfolio Standards (RPS) WA: 15% by 2020 MT: 15% by 2015 OR: 25% by 2025 NV: 20% by 2015 CA: 20% by 2010 AZ: 15% by 2025 Source: Pew Center for Global Climate Change (September 2008) http://www.pewclimate.org/what_s_being_done/in_the_states/rps.cfm
Comparison of Energy Crops vs. Electricity 1 ha is equal to 100 x 100 m 10,000 m2 An average-sized soccer field is 0.75 ha Source: Photon International, April 2007
Comparison of Energy Crops vs. Electricity biodiesel*3 1 ha is equal to 100 x 100 m 10,000 m2 21,500 km bioethanol (from wheat)*2 An average-sized soccer field is 0.75 ha 22,500 km biomass to liquid*3 60,000 km *1Average usage 16kWh/100 km *2Average usage 7.4 I/100 km fuel equivalent *3Average usage 6.5 I/100 km fuel equivalent biogas (from corn)*2 67,000 km 20,000 0 40,000 80,000 100,000 60,000 Source: Photon International, April 2007
Comparison of Energy Crops vs. Electricity biodiesel*3 1 ha is equal to 100 x 100 m 10,000 m2 21,500 km bioethanol (from wheat)*2 An average-sized soccer field is 0.75 ha 22,500 km biomass to liquid*3 60,000 km *1Average usage 16kWh/100 km *2Average usage 7.4 I/100 km fuel equivalent *3Average usage 6.5 I/100 km fuel equivalent biogas (from corn)*2 67,000 km electricity (Plug-in Hybrid operation)*1 3,250,000 km 200,000 20,000 0 40,000 80,000 100,000 60,000 Source: Photon International, April 2007
Comparison of Energy Crops vs. Electricity biodiesel*3 1 ha is equal to 100 x 100 m 10,000 m2 21,500 km bioethanol (from wheat)*2 An average-sized soccer field is 0.75 ha 22,500 km biomass to liquid*3 60,000 km *1Average usage 16kWh/100 km *2Average usage 7.4 I/100 km fuel equivalent *3Average usage 6.5 I/100 km fuel equivalent biogas (from corn)*2 67,000 km electricity (Plug-in Hybrid operation)*1 3,250,000 km 200,000 20,000 0 40,000 80,000 100,000 60,000 Source: Photon International, April 2007
Transportation Energy Use by Transport Mode (US) IEA Key world energy statistics 2005. IEA, Paris. See also: http://www.iea.org/dbtwwpd/Textbase/nppdf/free/2005/key2005.pdf
1. Aviation 8.4% 2. Petrochemicals 3. Maritime shipping 4.5% 4. Long haul trucks 19.1% 5. Rail transport 0.7% 6. Long trips by car 7. Commuting 61.4% 8. Picking up the kids (local trips) 9. Driving a Hummer Petroleum: A Hierarchy of Requirements vs. Available Substitutes 8.4% 4.5% 19.1% 0.7% 61.4%
Personal Vehicle Miles Driven Daily Drivers in the United States average 25 miles or less per day. – U.S. Dept. of Transportation Data 100% 75% Approximately 80% drive 50 miles a day or less % of Automobiles 50% 50% drive 25 miles a day or less 25% 0% 30 60 90 120 150 >155 Miles Source: US Department of Transportation, Federal Highway Administration, 1990 Nationwide Personal Transportation Survey (NPTS), Volpe National Transportation Systems Center, Cambridge, MA, 1991 National Personal Transportation Survey 1990
Mass Consumes Power (and Energy) Power (kW) Gross Vehicle Weight (GVW), lbs.
Mass Efficiency Bicycle Cargo Ship Freight Rail Freight Truck Mass Efficiency Urban Bus Commercial Rail Automobile Passenger Aircraft High Speed Rail Gross Moving Mass (Tonnes)
Increasing Mass Efficiency in Cars Bicycle Cargo Ship Freight Rail Freight Truck Mass Efficiency Urban Bus Commercial Rail Automobile Passenger Aircraft High Speed Rail Gross Moving Mass (Tonnes)
Energy Efficient Mass reduction Lightweight materials – aluminum, advanced composites Smaller size, compact Electric power train Increased efficiency Regeneration Functional Operating range matched with actual use “Right-size” the vehicle for typical use profile (including energy system) Appealing (curb appeal) Distinctive design Fun / Performance Affordable Acquisition cost Operating cost Conclusion: EVs as a Practical Car For Families
Infrastructure Existing Infrastructure
Future Technologies Efficiency Light Weight Energy Storage
Oregon – Early Adopters of Advanced Transportation Technology Metropolitan areas where hybrids are most popular
Suggested Reading A Thousand Barrels a Second: The Coming Oil Break Point and the Challenges Facing an Energy Dependent World– Peter Tertzakian Time for a Model Change: Re-engineering the Global Automotive Industry – Graeme P. Maxton and John Wormald The Innovator's Dilemma: When New Technologies Cause Great Firms to Fail – Clayton M. Christensen ZOOM: The Global Race to Fuel the Car of the Future –Iain Carson and Vijay V. Vaitheeswaran Crossing the Chasm – Geoffrey A. Moore
Questions & Answers Contact: john.thornton@porteon.net john.a.thornton@gmail.com Phone: +001 – 503–806-1760