Download
1 / 30
300 likes | 451 Vues
Project Cash Flow Analysis. Relevant cash flows Working capital treatment Unequal project lives.

E N D
Project Cash Flow Analysis • Relevant cash flows • Working capital treatment • Unequal project lives
Whenever the companies contemplate the development of a new product, they must conduct a capital budgeting analysis(including project cash flow). For example, Coke is deciding whether to produce and market a new lemonade product. Here are some of the factors that it would have to consider: • How many people would like the new product well enough to buy it, and how many units would each customer buy per year? • What share of the lemonade market could Coke expect to capture? • How important would price be; that is, would demand be greatly affected by a small change in price
If Coke did go into the lemonade market, and if it were highly profitable, how long would it take Pepsi and other competitors to follow, and how badly would Coke’s prices and sales be eroded? • How much would lemonade sales cut into the sales of Coke’s other products? • How large an investment would be required to set up a plant to produce lemonade and then launch a marketing campaign? • What would the production and distribution costs per unit be? • If the product were successful in the United States, might this lead to a worldwide expansion, hence to additional profits?
Proposed Project • Cost: $200,000 + $10,000 shipping + $30,000 installation. • Depreciable cost $240,000. • Inventories will rise by $25,000 and payables will rise by $5,000. • Economic life = 4 years. • Salvage value = $25,000. • Depreciation=MACRS 3-year class.
Incremental gross sales = $250,000. • Incremental cash operating costs = $125,000. • Tax rate = 40%. • Overall cost of capital = 10%.
Set up without numbers a time line for the project CFs. 0 1 2 3 4 Initial Outlay OCF1 OCF2 OCF3 OCF4 + Terminal CF NCF0 NCF1 NCF2 NCF3 NCF4
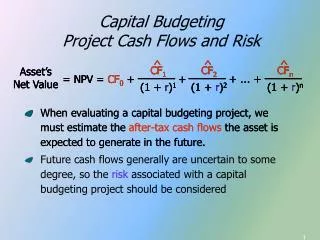
Incremental Cash Flow = Corporate cash flow withproject minus Corporate cash flow without project
Net Investment Outlay at t = 0 (000s) Equipment Freight + Inst. Change in NWC Net CF0 ($200) (40) (20) ($260) D NWC = $25,000 - $5,000 = $20,000.
Depreciation Basics Basis = Cost + Shipping + Installation $240,000
Straight-Line Method • For stockholder report or “book” purpose = Cost of Asset - Salvage Value Economic Life of Asset
Modified Accelerated Cost Recovery System(MACRS) Class Type of Property 3 yrs Certain special manufacturing tools 5 yrs Automobiles, light-duty trucks, computers, and certain special manufacturing equipment 7 yrs Most industrial equipment, office furniture, and fixtures 10 yrs Certain longer-lived types of equipment
Modified Accelerated Cost Recovery System(MACRS) Ownership Year 3 Yrs 5 Yrs 7 Yrs 10 Yrs 1 33% 20% 14% 10% 2 45 32 25 18 3 15 19 17 14 4 7 12 13 12 5 11 9 9 6 6 9 7 7 9 7 8 4 7 9 7 10 6 11 3 100 100 100 100
Annual Depreciation Expense (000s) Year 1 2 3 4 % 0.33 0.45 0.15 0.07 x Basis = Depr. $ 79 108 36 17 $240
Year 1 Operating Cash Flows (000s) Year 1 Net revenue Depreciation Before-tax income Taxes (40%) Net income Depreciation Net operating CF $125 (79) $ 46 (18) $ 28 79 $107
Year 4 Operating Cash Flows (000s) Year 1 Year 4 Net revenue Depreciation Before-tax income Taxes (40%) Net income Depreciation Net operating CF $125 (79) $ 46 (18) $ 28 79 $107 $125 (17) $108 (43) $ 65 17 $ 82
Net Terminal Cash Flow at t = 4 (000s) Salvage value Tax on SV Recovery on NWC Net terminal CF $25 (10) 20 $35
What if you terminate a project before the asset is fully depreciated? Cash flow from sale = Sale proceeds - taxes paid. Taxes are based on difference between sales price and tax basis, where: Basis = Original basis - Accum. deprec.
Example: If Sold After 3 Years (000s) • Original basis = $240. • After 3 years = $17 remaining. • Sales price = $25. • Tax on sale = 0.4($25-$17) = $3.2. • Cash flow = $25-$3.2=$21.7.
Project Net CFs on a Time Line 0 1 2 3 4 (260)* 107 118 89 117 I = 10. NPV = $81,573. IRR = 23.8%. *In thousands.
What is the project’s payback? (000s) 0 1 2 3 4 (260)* (260) 107 (153) 118 (35) 89 54 117 171 Cumulative: Payback = 2 + 35/89 = 2.4 years.
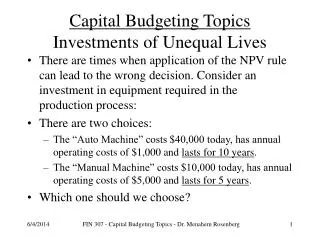
S and L are mutually exclusive and will be repeated. k = 10%. Which is better? (000s) 0 1 2 3 4 Project S: (100) Project L: (100) 60 33.5 60 33.5 33.5 33.5
S L CF0 -100,000 -100,000 CF1 60,000 33,500 Nj 2 4 I 10 10 NPV 4,132 6,190 NPVL > NPVS. But is L better? Can’t say yet. Need to perform common life analysis.
Note that Project S could be repeated after 2 years to generate additional profits. • Can use either replacement chain or equivalent annual annuity analysis to make decision.
Project S with Replication: k=10% Replacement Chain Approach (000s) 0 1 2 3 4 Project S: (100) (100) 60 60 60 (100) (40) 60 60 60 60 NPV = $7,547.
Or, use NPVs: 0 1 2 3 4 4,132 3,415 7,547 4,132 10% Compare to Project L NPV = $6,190.
Equivalent Annual Annuity(EAA) Approach Finds the constant annuity payment whose PV is equal to the project’s raw NPV over its original life.
EAA Calculator Solution • Project S • PV = Raw NPV = $4,132. • n = Original project life = 2. • k = 10%. • Solve for PMT = EAAS = $2,381. • Project L • PV = $6,190; n = 4; k = 10%. • Solve for PMT = EAAL = $1,953.
The project, in effect, provides an annuity of EAA. • EAAS > EAAL so pick S. • Replacement chains and EAA always lead to the same decision if cash flows are expected to stay the same.
If the cost to repeat S in two years rises to $105,000, which is best? (000s) 0 1 2 3 4 Project S: (100) 60 60 (105) (45) 60 60 NPVS = $3,415 < NPVL = $6,190. Now choose L.
Types of Abandonment • Sale to another party who can obtain greater cash flows, e.g., IBM sold PC division. • Abandon because losing money, e.g., smokeless cigarette.